

Question: Quality Control Chart Student learning outcomes Construct and demonstrate the application of control charts for monitoring process variation. Problem: A new machine has just been
Quality Control Chart
Student learning outcomes
Construct and demonstrate the application of control charts for monitoring process variation.
Problem:
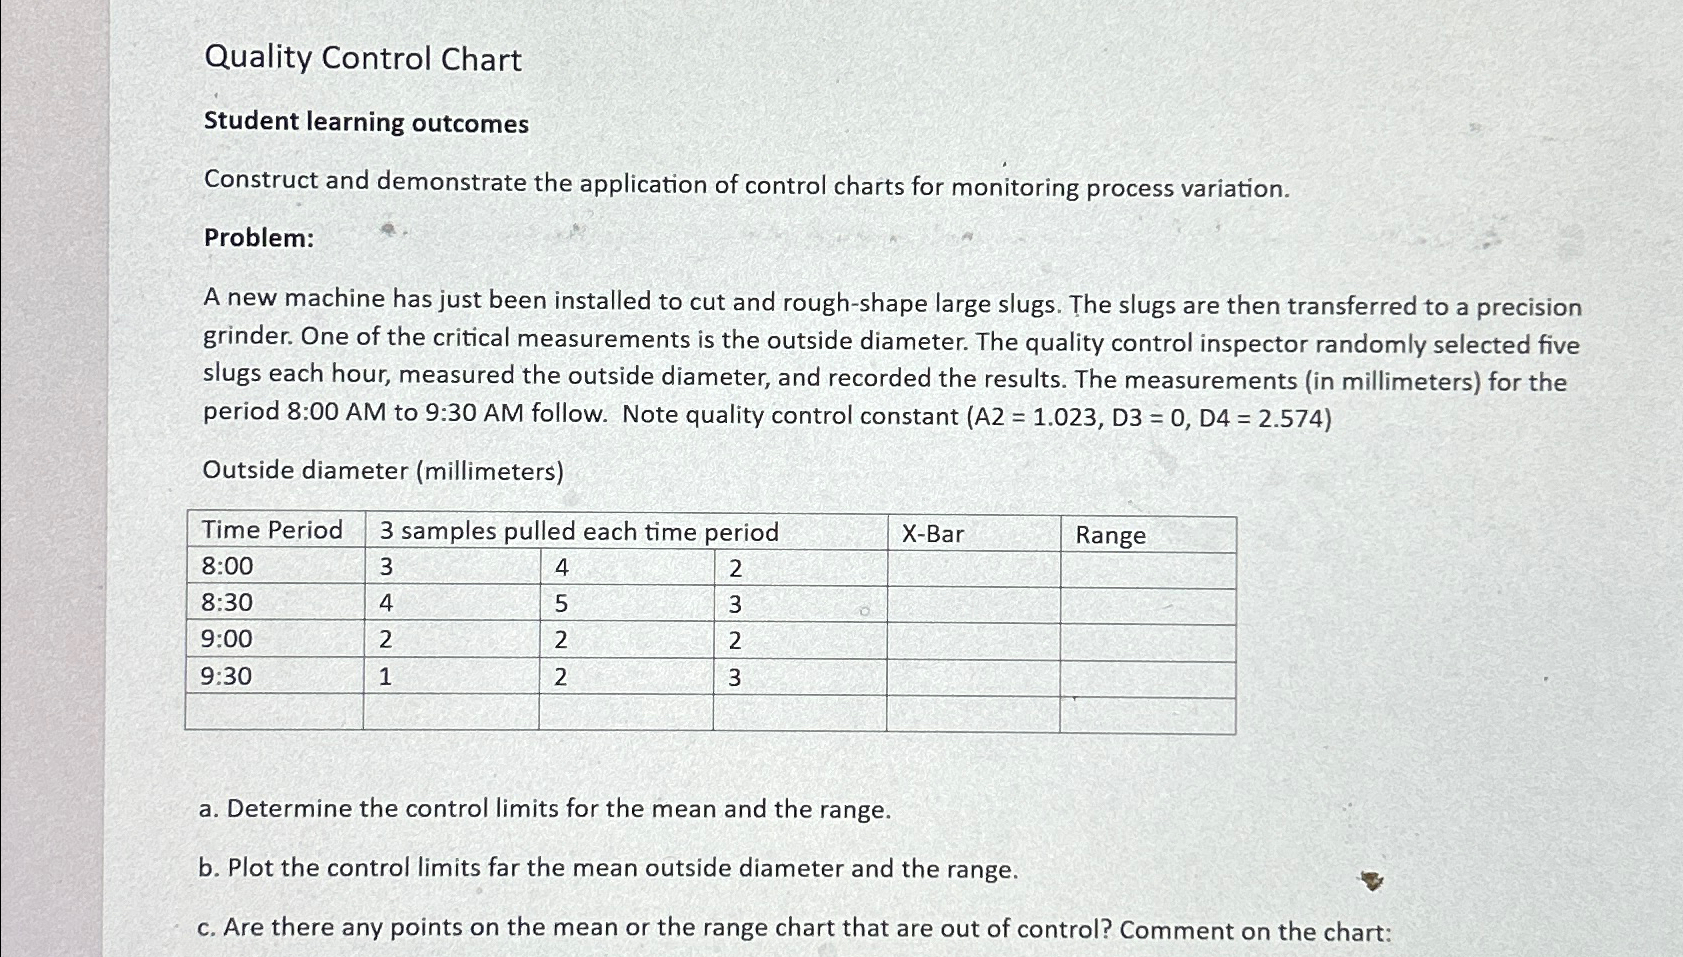
A new machine has just been installed to cut and roughshape large slugs. The slugs are then transferred to a precision grinder. One of the critical measurements is the outside diameter. The quality control inspector randomly selected five slugs each hour, measured the outside diameter, and recorded the results. The measurements in millimeters for the period : AM to : AM follow. Note quality control constant
Outside diameter millimeters
tableTime Period, samples pulled each time period,XBar,Range,,::::
a Determine the control limits for the mean and the range.
b Plot the control limits far the mean outside diameter and the range.
c Are there any points on the mean or the range chart that are out of control? Comment on the chart:
Step by Step Solution
There are 3 Steps involved in it
1 Expert Approved Answer
Step: 1 Unlock

Question Has Been Solved by an Expert!
Get step-by-step solutions from verified subject matter experts
Step: 2 Unlock
Step: 3 Unlock