

Question: Quality control charts usually have a central line and upper and lower control limit lines. Which of the following are reasons that the process being
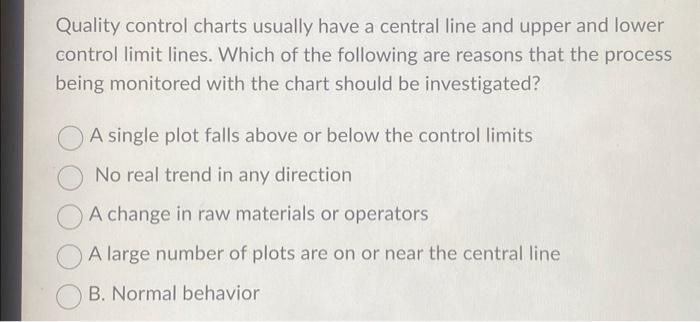
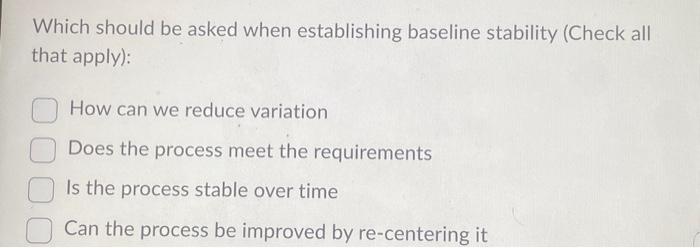
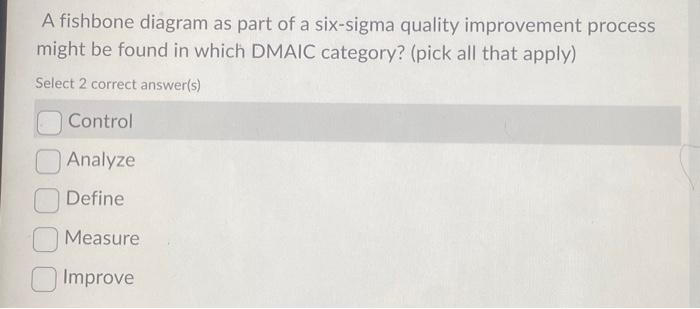
Quality control charts usually have a central line and upper and lower control limit lines. Which of the following are reasons that the process being monitored with the chart should be investigated? A single plot falls above or below the control limits No real trend in any direction A change in raw materials or operators A large number of plots are on or near the central line B. Normal behavior Which should be asked when establishing baseline stability (Check all that apply): How can we reduce variation Does the process meet the requirements Is the process stable over time Can the process be improved by re-centering it A fishbone diagram as part of a six-sigma quality improvement process might be found in which DMAIC category? (pick all that apply) Select 2 correct answer(s) Control Analyze Define Measure Improve
Step by Step Solution
There are 3 Steps involved in it

Get step-by-step solutions from verified subject matter experts