

Question: quality control Problem 5: 3, determine the X and R charts for the data on shampoo weights in kilograms given below (Chapter 6). X X2
quality control
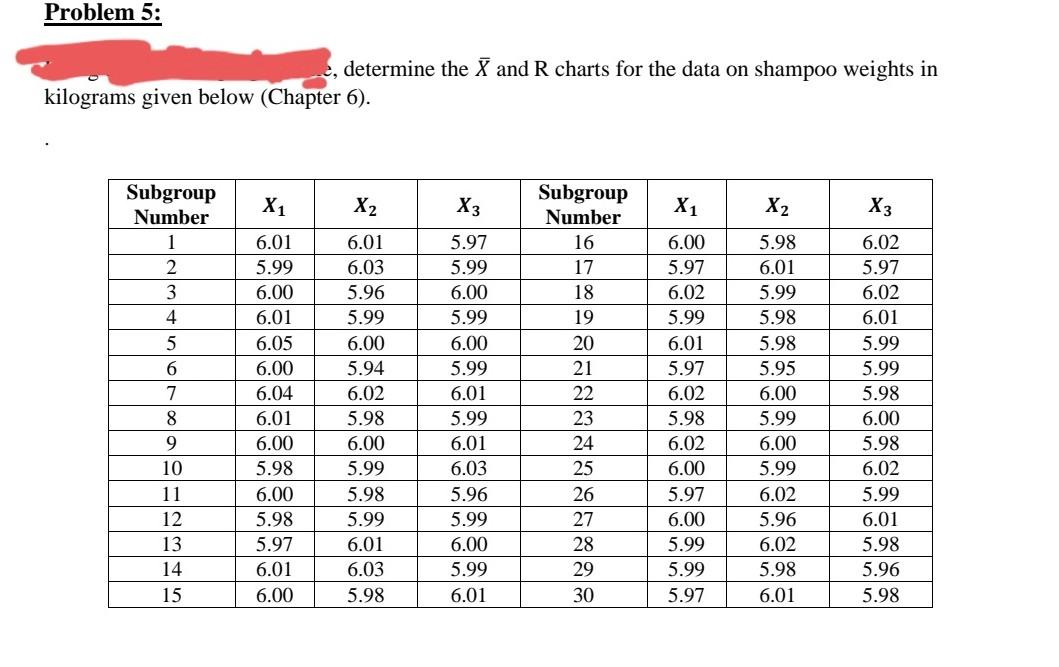
Problem 5: 3, determine the X and R charts for the data on shampoo weights in kilograms given below (Chapter 6). X X2 X3 X1 X2 X3 Subgroup Number 1 2 3 4 5 6 7 8 9 10 11 12 13 14 15 6.01 5.99 6.00 6.01 6.05 6.00 6.04 6.01 6.00 5.98 6.00 5.98 5.97 6.01 6.00 6.01 6.03 5.96 5.99 6.00 5.94 6.02 5.98 6.00 5.99 5.98 5.99 6.01 6.03 5.98 5.97 5.99 6.00 5.99 6.00 5.99 6.01 5.99 6.01 6.03 5.96 5.99 6.00 5.99 6.01 Subgroup Number 16 17 18 19 20 21 22 23 24 25 26 27 28 29 30 6.00 5.97 6.02 5.99 6.01 5.97 6.02 5.98 6.02 6.00 5.97 6.00 5.99 5.99 5.97 5.98 6.01 5.99 5.98 5.98 5.95 6.00 5.99 6.00 5.99 6.02 5.96 6.02 5.98 6.01 6.02 5.97 6.02 6.01 5.99 5.99 5.98 6.00 5.98 6.02 5.99 6.01 5.98 5.96 5.98Step by Step Solution
There are 3 Steps involved in it
1 Expert Approved Answer
Step: 1 Unlock

Question Has Been Solved by an Expert!
Get step-by-step solutions from verified subject matter experts
Step: 2 Unlock
Step: 3 Unlock