Question: Quality management answer each question step-by-step clearly and ( type your answer to I can read it and write it good to I can submit

Quality management

answer each question step-by-step clearly and

( type your answer to I can read it and write it good to I can submit my homework )

don't forget type your answer with clear font

answer by tyre your 6 & 12 and 13 chose the right answer
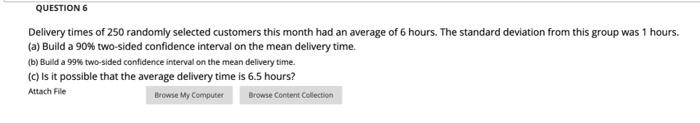
answer question 6

Quality management answer each question

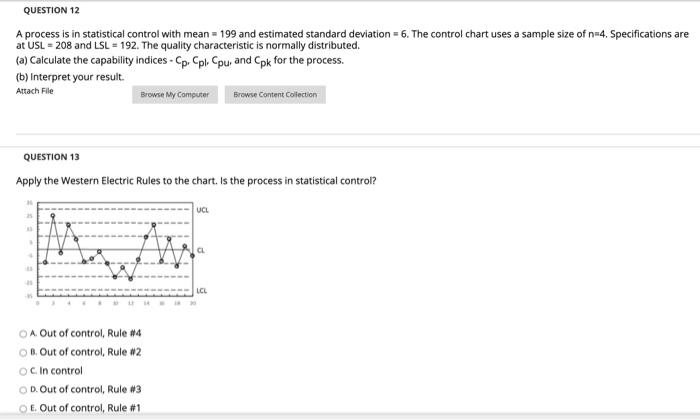
answer question ( type your answer what clear font ) 12 and Watch no right answer 13

Quality management answer each question

QUESTION 6 Delivery times of 250 randomly selected customers this month had an average of 6 hours. The standard deviation from this group was 1 hours. (a) Build a 90% two-sided confidence interval on the mean delivery time (b) Build a 99% two-sided confidence interval on the mean delivery time. (c) Is it possible that the average delivery time is 6.5 hours? Attach File Browse My Computer Browse Content Collection QUESTION 12 A process is in statistical control with mean = 199 and estimated standard deviation = 6. The control chart uses a sample size of n 4. Specifications are at USL = 208 and LSL = 192. The quality characteristic is normally distributed. (a) Calculate the capability indices - Cp Cpl. Cpu, and Cpk for the process. (b) Interpret your result. Attach File Browse Content Collection Browse My Computer QUESTION 13 Apply the Western Electric Rules to the chart. Is the process in statistical control? UCL LCL A Out of control, Rule #4 B. Out of control, Rule #2 OC in control D. Out of control, Rule #3 OE. Out of control, Rule #1

Step by Step Solution

There are 3 Steps involved in it

1 Expert Approved Answer
Step: 1 Unlock blur-text-image
Question Has Been Solved by an Expert!

Get step-by-step solutions from verified subject matter experts

Step: 2 Unlock
Step: 3 Unlock

Students Have Also Explored These Related General Management Questions!