

Question: quality Management QUESTION TWO a) Explain the differences between X-bar and R-charts. When should they be used and why is it important to use them
quality Management
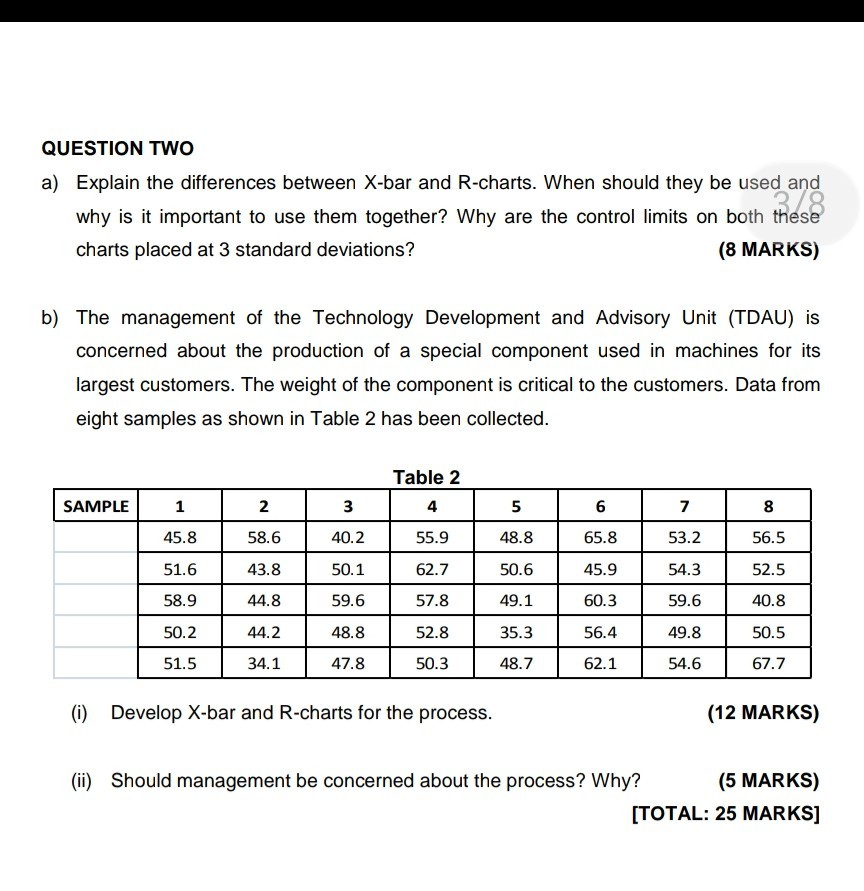
QUESTION TWO a) Explain the differences between X-bar and R-charts. When should they be used and why is it important to use them together? Why are the control limits on both these charts placed at 3 standard deviations? (8 MARKS) thes b) The management of the Technology Development and Advisory Unit (TDAU) is concerned about the production of a special component used in machines for its largest customers. The weight of the component is critical to the customers. Data from eight samples as shown in Table 2 has been collected. Table 2 4 SAMPLE 1 2 3 5 6 7 8 45.8 58.6 40.2 55.9 48.8 65.8 53.2 56.5 51.6 43.8 50.1 62.7 50.6 45.9 54.3 52.5 58.9 44.8 59.6 57.8 49.1 60.3 59.6 40.8 50.2 44.2 48.8 52.8 35.3 56.4 49.8 50.5 51.5 34.1 47.8 50.3 48.7 62.1 54.6 67.7 (i) Develop X-bar and R-charts for the process. (12 MARKS) (ii) Should management be concerned about the process? Why? (5 MARKS) [TOTAL: 25 MARKS]Step by Step Solution
There are 3 Steps involved in it
1 Expert Approved Answer
Step: 1 Unlock

Question Has Been Solved by an Expert!
Get step-by-step solutions from verified subject matter experts
Step: 2 Unlock
Step: 3 Unlock