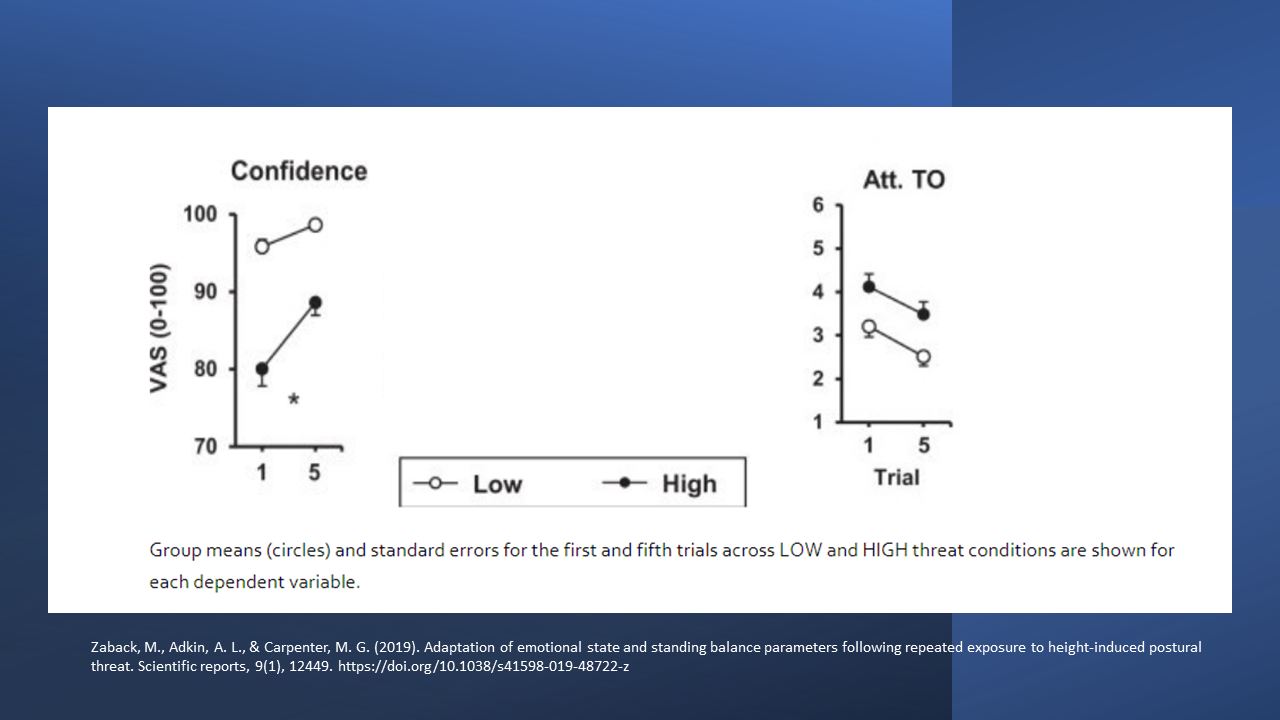
Question: Quantative Analysis 1. Based on the visualization below, across what dependent variable is a main effect found for Dr. Adkin's data? ffConfidence Att. TO 100

Quantative Analysis

1.

Based on the visualization below, across what dependent variable is a main effect found for Dr. Adkin's data?

Quantative Analysis 1. Based on the visualizationQuantative Analysis 1. Based on the visualizationQuantative Analysis 1. Based on the visualizationQuantative Analysis 1. Based on the visualizationQuantative Analysis 1. Based on the visualization
\f\fConfidence Att. TO 100 6 5 90 A VAS (0-100) 3 80 N 70 1 5 1 O- Low High Trial Group means (circles) and standard errors for the first and fifth trials across LOW and HIGH threat conditions are shown for each dependent variable. Zaback, M., Adkin, A. L., & Carpenter, M. G. (2019). Adaptation of emotional state and standing balance parameters following repeated exposure to height-induced postural threat. Scientific reports, 9(1), 12449. https://doi.org/10.1038/s41598-019-48722-zNutrient Beginning End Sex Time Interaction M + SD M + SD p; np2 p; np2 p; npz_ Saturated Fat (g)

Step by Step Solution

There are 3 Steps involved in it

1 Expert Approved Answer
Step: 1 Unlock blur-text-image
Question Has Been Solved by an Expert!

Get step-by-step solutions from verified subject matter experts

Step: 2 Unlock
Step: 3 Unlock

Students Have Also Explored These Related Mathematics Questions!