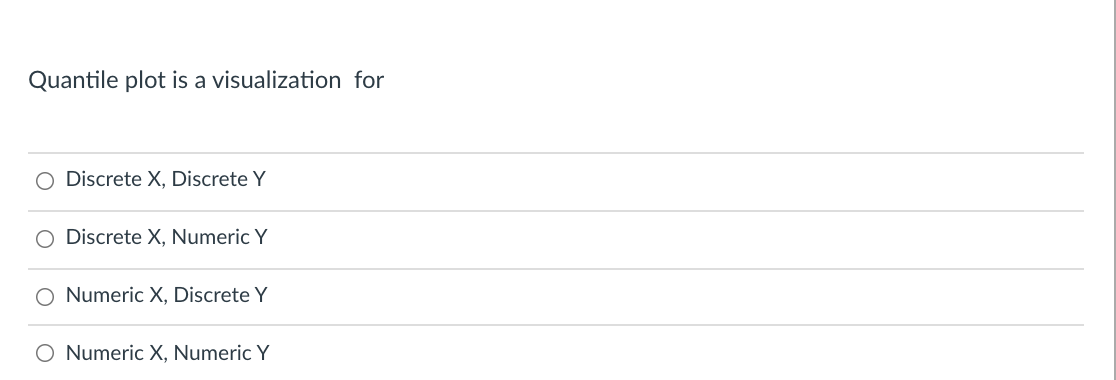
Question: Quantile plot is a visualization for a O Discrete X, Discrete Y Discrete X, Numeric Y O Numeric X, Discrete Y O Numeric X, Numeric

Quantile plot is a visualization for a O DiscreteQuantile plot is a visualization for a O Discrete

Quantile plot is a visualization for a O Discrete X, Discrete Y Discrete X, Numeric Y O Numeric X, Discrete Y O Numeric X, Numeric Y In the k-NN algorithm, after standardizationormalization, what is the ratio of the standard deviation to mean of the normalized variable? 1 O Inf (Infinity) O None of the remaining choices

Step by Step Solution

There are 3 Steps involved in it

1 Expert Approved Answer
Step: 1 Unlock blur-text-image
Question Has Been Solved by an Expert!

Get step-by-step solutions from verified subject matter experts

Step: 2 Unlock
Step: 3 Unlock

Students Have Also Explored These Related General Management Questions!