

Question: Quantile regression as linear programming A way, favored in textbooks: first, least squares problem can be rewritten as e min! i ,e subject to
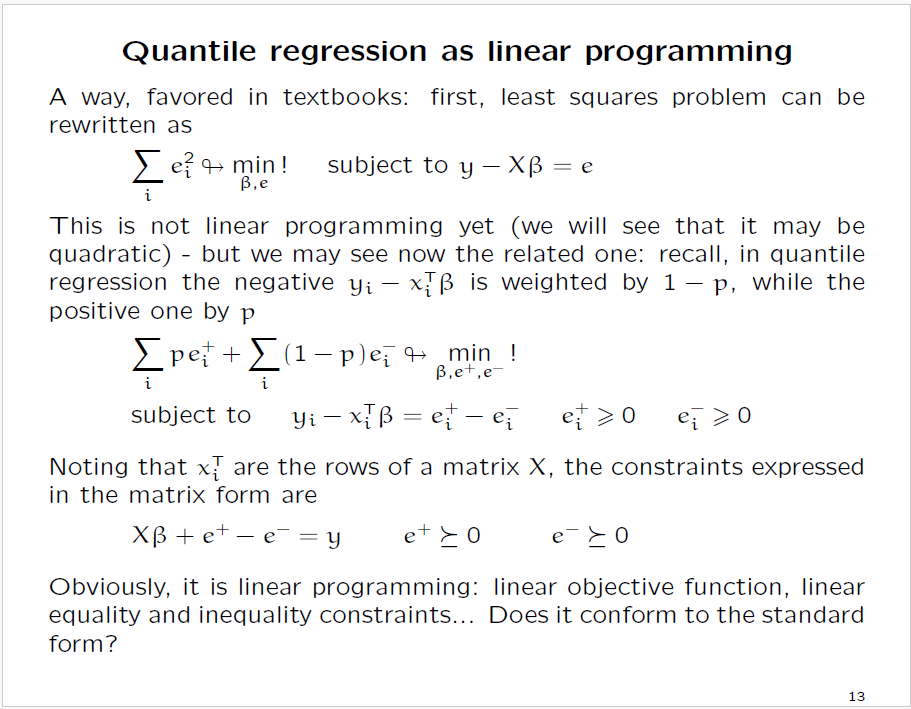
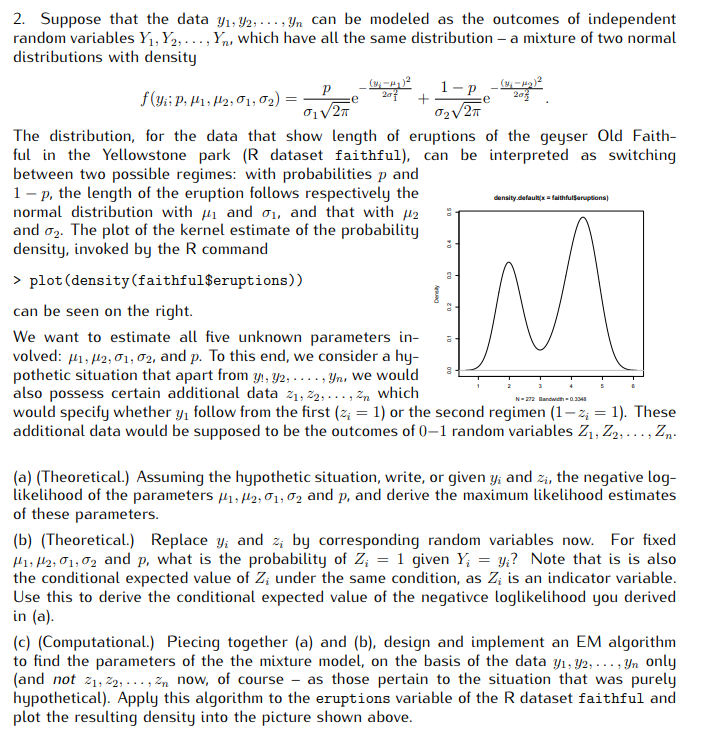
Quantile regression as linear programming A way, favored in textbooks: first, least squares problem can be rewritten as e min! i ,e subject to y X = e This is not linear programming yet (we will see that it may be quadratic) but we may see now the related one: recall, in quantile regression the negative yi x is weighted by 1 - p, while the positive one by p - - pet + (1 p)e min! i subject to - yi x = e ei e > 0 - e > 0 Noting that x are the rows of a matrix X, the constraints expressed in the matrix form are X + e+ e = y - e+ 0 e > O Obviously, it is linear programming: linear objective function, linear equality and inequality constraints... Does it conform to the standard form? 13 2. Suppose that the data 1, 2, ..., yn can be modeled as the outcomes of independent random variables Y, Y2,..., Y, which have all the same distribution - a mixture of two normal distributions with density f(yi P, H1, H2, 1, 2)= = 1-p (-)2 20 + C2V2 The distribution, for the data that show length of eruptions of the geyser Old Faith- ful in the Yellowstone park (R dataset faithful), can be interpreted as switching between two possible regimes: with probabilities p and 1-p, the length of the eruption follows respectively the normal distribution with and 1, and that with 2 and 2. The plot of the kernel estimate of the probability density, invoked by the R command > plot (density (faithful$eruptions)) can be seen on the right. Density density.default x=faithfulSeruptions) M We want to estimate all five unknown parameters in- volved: H1, H2, 01, 02, and p. To this end, we consider a hy- pothetic situation that apart from y!, y2,..., yn, we would also possess certain additional data 21,22,..., which would specify whether y follow from the first (z = 1) or the second regimen (1-% = 1). These additional data would be supposed to be the outcomes of 0-1 random variables Z1, Z2, ..., Zn. N-272 Bandwidth 0.3348 (a) (Theoretical.) Assuming the hypothetic situation, write, or given y, and zi, the negative log- likelihood of the parameters H1, H2, 01, 02 and p, and derive the maximum likelihood estimates of these parameters. (b) (Theoretical.) Replace y, and z; by corresponding random variables now. For fixed H1, H2, 01, 02 and p, what is the probability of Z = 1 given Y = y;? Note that is is also the conditional expected value of Z; under the same condition, as Z; is an indicator variable. Use this to derive the conditional expected value of the negativce loglikelihood you derived in (a). (c) (Computational.) Piecing together (a) and (b), design and implement an EM algorithm to find the parameters of the the mixture model, on the basis of the data y1, 2,..., Yn only (and not 21, 22, .., Zn now, of course as those pertain to the situation that was purely hypothetical). Apply this algorithm to the eruptions variable of the R dataset faithful and plot the resulting density into the picture shown above.
Step by Step Solution
There are 3 Steps involved in it

Get step-by-step solutions from verified subject matter experts