

Question: Quantitative Analysis Question 3 The following ACF plots were produced for raw data of monthly sales of two different variables, A and B. a) Explain
Quantitative Analysis
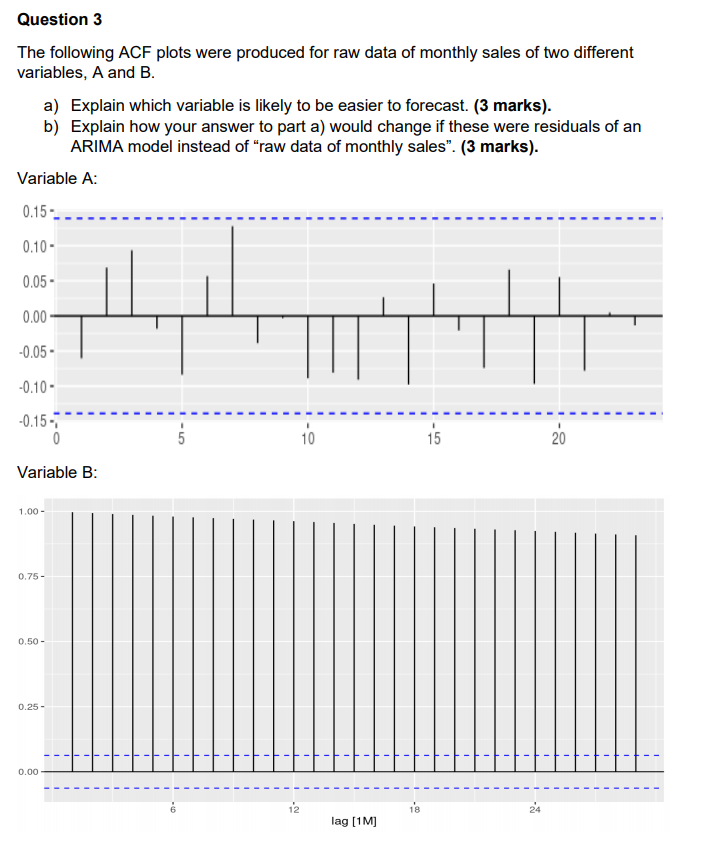
Question 3 The following ACF plots were produced for raw data of monthly sales of two different variables, A and B. a) Explain which variable is likely to be easier to forecast. (3 marks). b) Explain how your answer to part a) would change if these were residuals of an ARIMA model instead of raw data of monthly sales. (3 marks). Variable A: 0.15 0.10- 0.05- 0.00 -0.05 -0.10. -0.15 - 0 5 10 15 20 Variable B: 1.00 - 0.75 - 0.50 - 0.25 - 0.00 - - 1 12 18 24 lag (1M) Question 3 The following ACF plots were produced for raw data of monthly sales of two different variables, A and B. a) Explain which variable is likely to be easier to forecast. (3 marks). b) Explain how your answer to part a) would change if these were residuals of an ARIMA model instead of raw data of monthly sales. (3 marks). Variable A: 0.15 0.10- 0.05- 0.00 -0.05 -0.10. -0.15 - 0 5 10 15 20 Variable B: 1.00 - 0.75 - 0.50 - 0.25 - 0.00 - - 1 12 18 24 lag (1M)
Step by Step Solution
There are 3 Steps involved in it

Get step-by-step solutions from verified subject matter experts