

Question: Quantitative Considerations: Because materiality is relative, it is necessary to have bases for establishing whether misstatements are material. A base is a critical item of
Quantitative Considerations: Because materiality is relative, it is necessary to have bases for establishing whether misstatements are material. A base is a critical item of which users tend to focus while making decisions. The base will vary depending on the nature of the clients business. Typical bases may include net income before taxes, net sales, total assets and stockholders equity. Percentages typically range from 1%-10% depending on the base.
| Base (from previous year) | Dollar Amount of Base | Percentage Range | Base x Percentage |
| Net income before taxes |
| 3%-6% |
|
| Total assets |
| 1%-3% |
|
| Net sales |
| 1%-3% |
|
Qualitative Considerations: Certain types of misstatements are likely to be more important to users than others, even if the dollar amounts are the same. For example, misstatements that involve fraud may be more important to users than misstatements due to unintentional errors. Fraud reflects on the integrity of management and other employees of the client.
| Item to be Considered | Impact on Materiality |
| Outdated accounting systems | Reduce the level |
| New client | Reduce the level |
| Previous year qualified opinion | Reduce the level |
Preliminary Judgment about Materiality: Combine the quantitative and qualitative considerations into one overall materiality level.
Materiality Level = 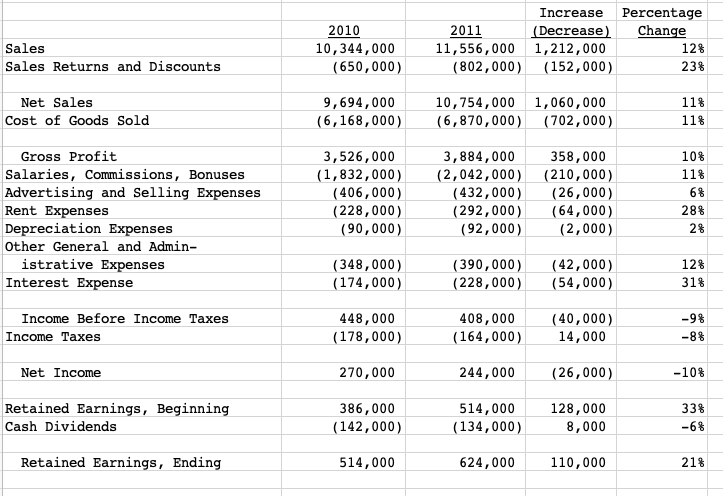
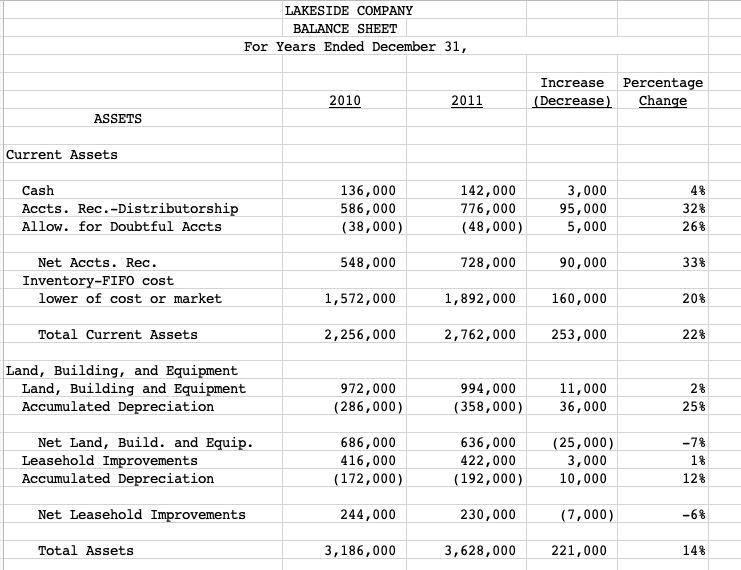
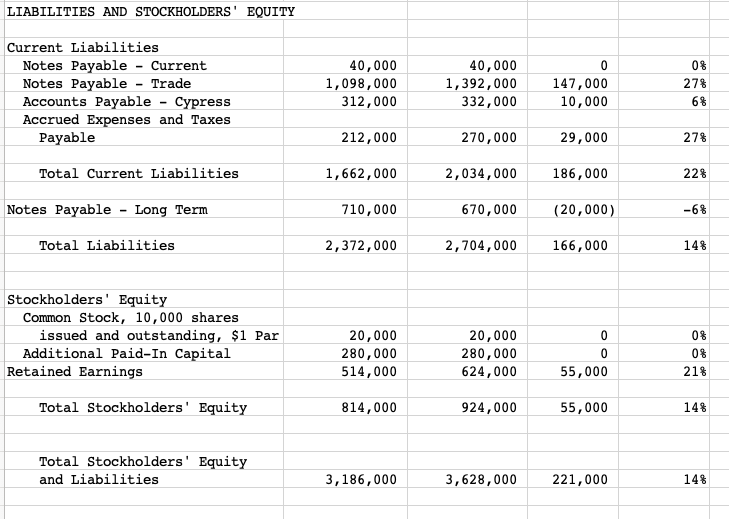
2010 10,344,000 (650,000) Sales Sales Returns and Discounts Percentage Change 12% 23% Increase 2011 (Decrease) 11,556,000 1,212,000 (802,000) (152,000) Net Sales Cost of Goods Sold 9,694,000 (6,168,000) 10,754,000 1,060,000 (6,870,000) (702,000) 11% 11% Gross Profit Salaries, Commissions, Bonuses Advertising and selling Expenses Rent Expenses Depreciation Expenses Other General and Admin- istrative Expenses Interest Expense 3,526,000 (1,832,000) (406,000) (228,000) (90,000) 3,884,000 (2,042,000) (432,000) (292,000) (92,000) 358,000 (210,000) (26,000) (64,000) (2,000) 10% 11% 6% 28% 2% (348,000) (174,000) (390,000) (228,000) (42,000) (54,000) 12% 31% Income Before Income Taxes Income Taxes 448,000 (178,000) 408,000 (164,000) (40,000) 14,000 -98 -8% Net Income 270,000 244,000 (26,000) -10% Retained Earnings, Beginning Cash Dividends 386,000 (142,000) 514,000 (134,000) 128,000 8,000 33% -6% Retained Earnings, Ending 514,000 624,000 110,000 21% LAKESIDE COMPANY BALANCE SHEET For Years Ended December 31, Increase (Decrease) Percentage Change 2010 2011 ASSETS Current Assets do Cash Accts. Rec.-Distributorship Allow. for Doubtful Accts 136,000 586,000 (38,000) 142,000 776,000 (48,000) 3,000 95,000 5,000 4 32% 26% 548,000 728,000 90,000 33% Net Accts. Rec. Inventory-FIFO cost lower of cost or market 1,572,000 1,892,000 160,000 20% Total Current Assets 2,256,000 2,762,000 253,000 22% Land, Building, and Equipment Land, Building and Equipment Accumulated Depreciation 972,000 (286,000) 994,000 (358,000) 11,000 36,000 2% 25% Net Land, Build. and Equip. Leasehold Improvements Accumulated Depreciation 686,000 416,000 (172,000) 636,000 422,000 (192,000) (25,000) 3,000 10,000 -7% 1 12% Or Net Leasehold Improvements 244,000 230,000 (7,000) -6% Total Assets 3,186,000 3,628,000 221,000 14% LIABILITIES AND STOCKHOLDERS' EQUITY Current Liabilities Notes Payable - Current Notes Payable - Trade Accounts Payable Cypress Accrued Expenses and Taxes Payable 40,000 1,098,000 312,000 40,000 1,392,000 332,000 0 147,000 10,000 0% 27% 6% 212,000 270,000 29,000 27% Total Current Liabilities 1,662,000 2,034,000 186,000 22% Notes Payable - Long Term 710,000 670,000 (20,000) -6% Total Liabilities 2,372,000 2,704,000 166,000 14% Stockholders' Equity Common Stock, 10,000 shares issued and outstanding, $1 Par Additional Paid-In Capital Retained Earnings 20,000 280,000 514,000 20,000 280,000 624,000 0 0 55,000 0% 0% 21% Total Stockholders' Equity 814,000 924,000 55,000 14% Total Stockholders' Equity and Liabilities 3,186,000 3,628,000 221,000 14% 2010 10,344,000 (650,000) Sales Sales Returns and Discounts Percentage Change 12% 23% Increase 2011 (Decrease) 11,556,000 1,212,000 (802,000) (152,000) Net Sales Cost of Goods Sold 9,694,000 (6,168,000) 10,754,000 1,060,000 (6,870,000) (702,000) 11% 11% Gross Profit Salaries, Commissions, Bonuses Advertising and selling Expenses Rent Expenses Depreciation Expenses Other General and Admin- istrative Expenses Interest Expense 3,526,000 (1,832,000) (406,000) (228,000) (90,000) 3,884,000 (2,042,000) (432,000) (292,000) (92,000) 358,000 (210,000) (26,000) (64,000) (2,000) 10% 11% 6% 28% 2% (348,000) (174,000) (390,000) (228,000) (42,000) (54,000) 12% 31% Income Before Income Taxes Income Taxes 448,000 (178,000) 408,000 (164,000) (40,000) 14,000 -98 -8% Net Income 270,000 244,000 (26,000) -10% Retained Earnings, Beginning Cash Dividends 386,000 (142,000) 514,000 (134,000) 128,000 8,000 33% -6% Retained Earnings, Ending 514,000 624,000 110,000 21% LAKESIDE COMPANY BALANCE SHEET For Years Ended December 31, Increase (Decrease) Percentage Change 2010 2011 ASSETS Current Assets do Cash Accts. Rec.-Distributorship Allow. for Doubtful Accts 136,000 586,000 (38,000) 142,000 776,000 (48,000) 3,000 95,000 5,000 4 32% 26% 548,000 728,000 90,000 33% Net Accts. Rec. Inventory-FIFO cost lower of cost or market 1,572,000 1,892,000 160,000 20% Total Current Assets 2,256,000 2,762,000 253,000 22% Land, Building, and Equipment Land, Building and Equipment Accumulated Depreciation 972,000 (286,000) 994,000 (358,000) 11,000 36,000 2% 25% Net Land, Build. and Equip. Leasehold Improvements Accumulated Depreciation 686,000 416,000 (172,000) 636,000 422,000 (192,000) (25,000) 3,000 10,000 -7% 1 12% Or Net Leasehold Improvements 244,000 230,000 (7,000) -6% Total Assets 3,186,000 3,628,000 221,000 14% LIABILITIES AND STOCKHOLDERS' EQUITY Current Liabilities Notes Payable - Current Notes Payable - Trade Accounts Payable Cypress Accrued Expenses and Taxes Payable 40,000 1,098,000 312,000 40,000 1,392,000 332,000 0 147,000 10,000 0% 27% 6% 212,000 270,000 29,000 27% Total Current Liabilities 1,662,000 2,034,000 186,000 22% Notes Payable - Long Term 710,000 670,000 (20,000) -6% Total Liabilities 2,372,000 2,704,000 166,000 14% Stockholders' Equity Common Stock, 10,000 shares issued and outstanding, $1 Par Additional Paid-In Capital Retained Earnings 20,000 280,000 514,000 20,000 280,000 624,000 0 0 55,000 0% 0% 21% Total Stockholders' Equity 814,000 924,000 55,000 14% Total Stockholders' Equity and Liabilities 3,186,000 3,628,000 221,000 14%
Step by Step Solution
There are 3 Steps involved in it

Get step-by-step solutions from verified subject matter experts