

Question: QUANTITATIVE METHODS 19. All else being equal, an investor would most likely prefer portfolios with return distributions that have: a. Positive skewness. b. Negative skewness.
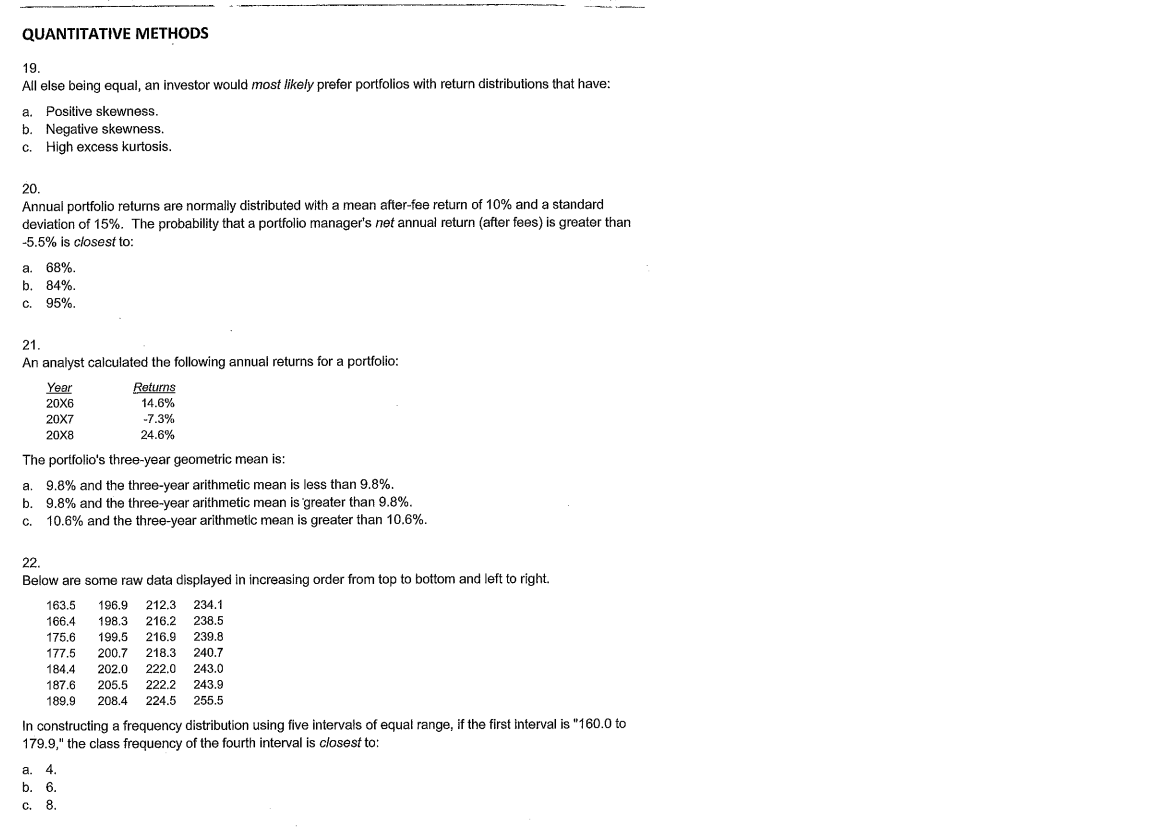
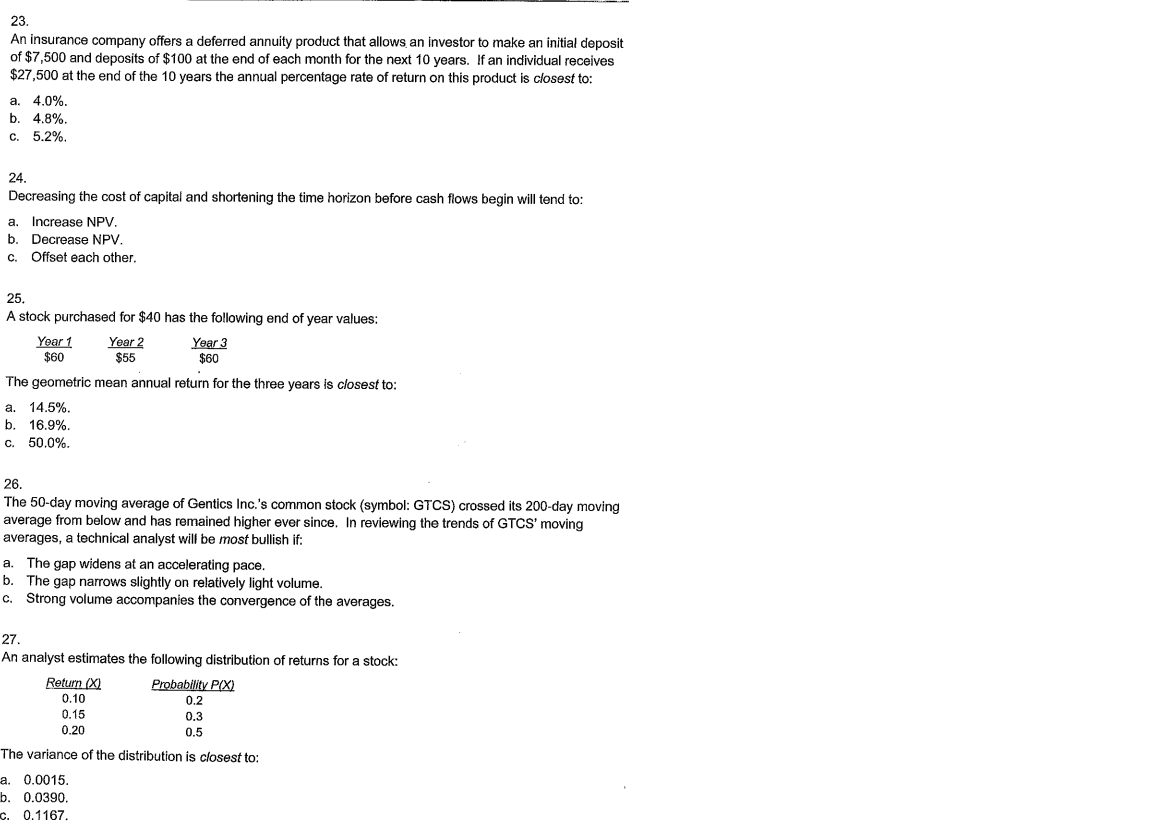
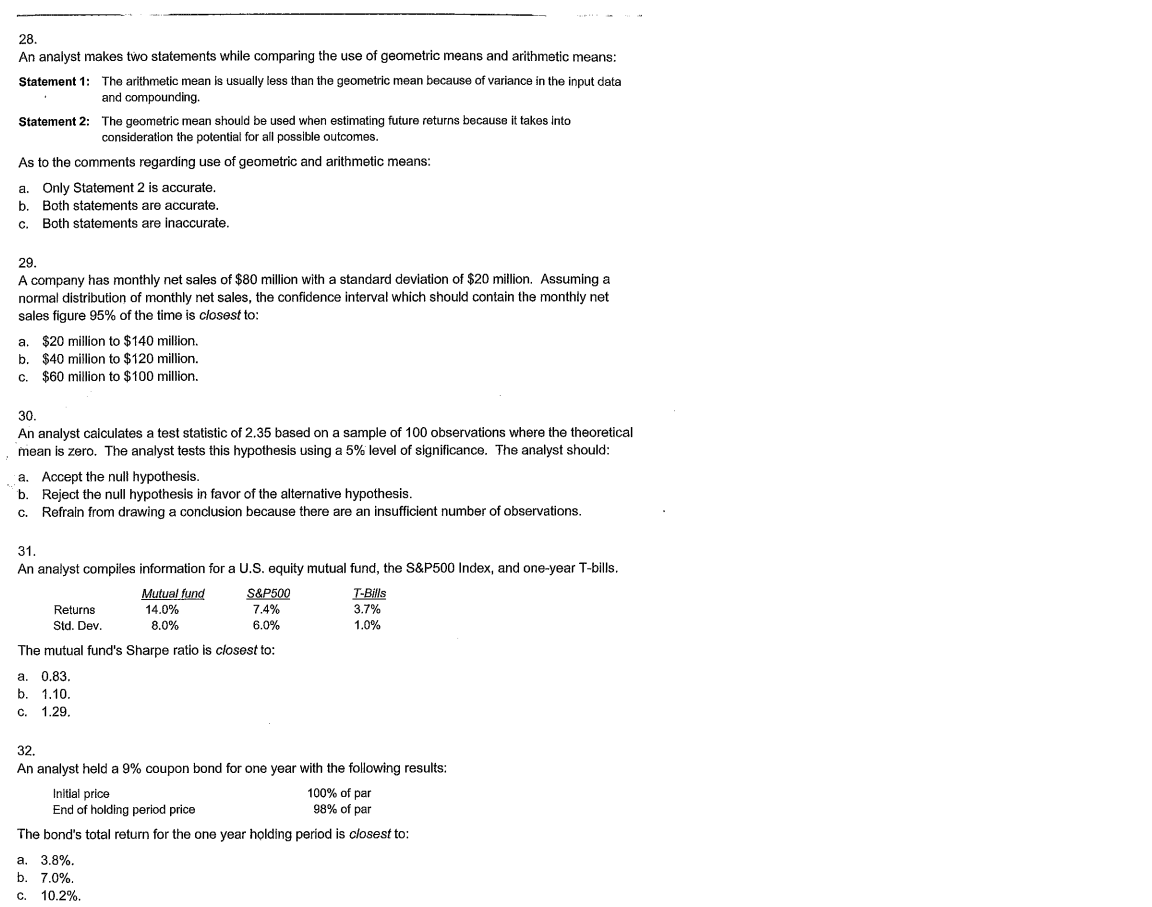
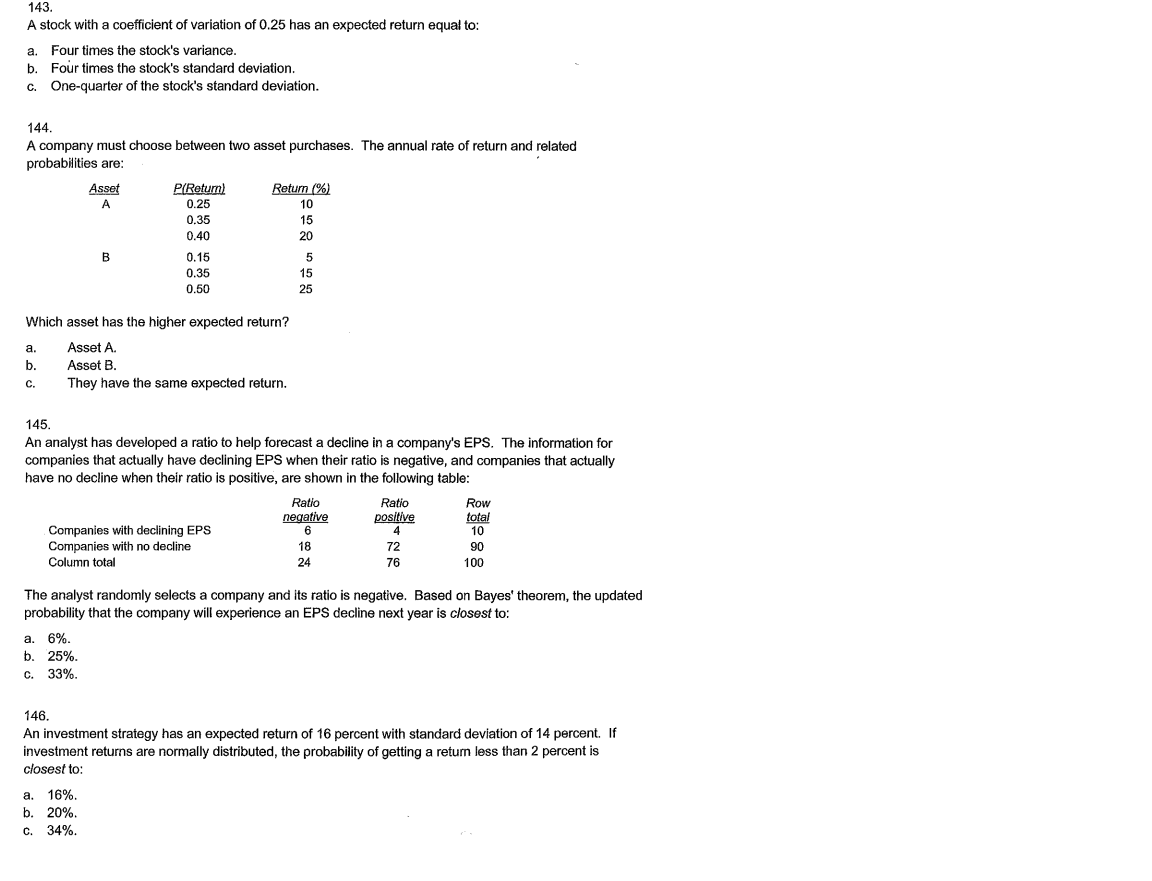
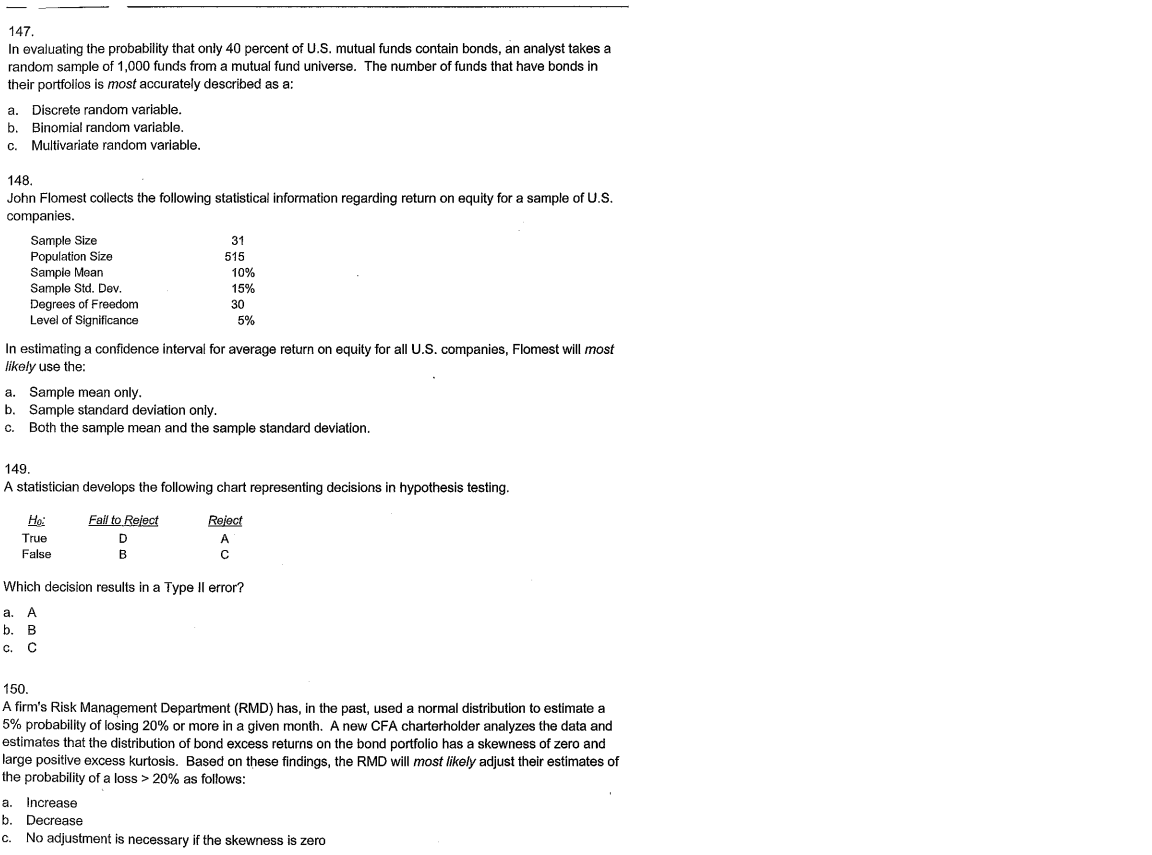
QUANTITATIVE METHODS 19. All else being equal, an investor would most likely prefer portfolios with return distributions that have: a. Positive skewness. b. Negative skewness. c. High excess kurtosis. 20. . Annual portfolio returns are normally distributed with a mean after-fee return of 10% and a standard deviation of 15%. The probability that a portfolio manager's net annual return (after fees) is greater than -5.5% is closest to: a. 68% b. 84%. c. 95%. 21. An analyst calculated the following annual returns for a portfolio: Year Returns 20X6 14.6% 20X7 -7.3% 20X8 24.6% a. The portfolio's three-year geometric mean is: 9.8% and the three-year arithmetic mean is less than 9.8%. b. 9.8% and the three-year arithmetic mean is greater than 9.8%. c. 10.6% and the three-year arithmetic mean is greater than 10.6%. 166.4 22. Below are some raw data displayed in increasing order from top to bottom and left to right. 163.5 196.9 212,3 234.1 198.3 216.2 238.5 175.6 199.5 216.9 239.8 177.5 200.7 218.3 240.7 184,4 202.0 222.0 243.0 205.5 222.2 243.9 189.9 208.4 224.5 255.5 187.6 In constructing a frequency distribution using five intervals of equal range, if the first interval is "160.0 to 179.9," the class frequency of the fourth interval is closest to: a. 4. b. 6. . c. 8. 23. . An insurance company offers a deferred annuity product that allows an investor to make an initial deposit of $7,500 and deposits of $100 at the end of each month for the next 10 years. If an individual receives $27,500 at the end of the 10 years the annual percentage rate of return on this product is closest to: a. 4.0%. b. 4.8% C. 5.2%. 24. Decreasing the cost of capital and shortening the time horizon before cash flows begin will tend to: a. Increase NPV. b. Decrease NPV. c. Offset each other. 25. A stock purchased for $40 has the following end of year values: Year 1 Year 2 Year 3 $60 $55 $60 The geometric mean annual return for the three years is closest to: a. 14.5%. b. 16.9% c. 50.0%. 26. The 50-day moving average of Gentics Inc.'s common stock (symbol: GTCS) crossed its 200-day moving average from below and has remained higher ever since. In reviewing the trends of GTCS' moving averages, a technical analyst will be most bullish if: a. The gap widens at an accelerating pace. b. The gap narrows slightly on relatively light volume. c. Strong volume accompanies the convergence of the averages. 27. An analyst estimates the following distribution of returns for a stock: Return (X) Probability PIX) 0.10 0.2 0.15 0.3 0.20 0.5 The variance of the distribution is closest to: a. 0.0015. b. 0.0390. c. 0.1167. 28. An analyst makes two statements while comparing the use of geometric means and arithmetic means: Statement 1: The arithmetic mean is usually less than the geometric mean because of variance in the input data and compounding. Statement 2: The geometric mean should be used when estimating future returns because it takes into consideration the potential for all possible outcomes. As to the comments regarding use of geometric and arithmetic means: a. Only Statement 2 is accurate. . b. Both statements are accurate. c. Both statements are inaccurate. 29. A company has monthly net sales of $80 million with a standard deviation of $20 million. Assuming a normal distribution of monthly net sales, the confidence interval which should contain the monthly net sales figure 95% of the time is closest to: a. $20 million to $140 million. b. $40 million to $120 million. C. $60 million to $100 million. 30. An analyst calculates a test statistic of 2.35 based on a sample of 100 observations where the theoretical mean is zero. The analyst tests this hypothesis using a 5% level of significance. The analyst should: a. Accept the null hypothesis. b. Reject the null hypothesis in favor of the alternative hypothesis. c. Refrain from drawing a conclusion because there are an insufficient number of observations. 31. An analyst compiles information for a U.S. equity mutual fund, the S&P500 Index, and one-year T-bills. a Mutual fund S&P500 T-Bills Returns 14.0% 7.4% 3.7% Std. Dev. . . 8.0% 6.0% 1.0% The mutual fund's Sharpe ratio is closest to: a. 0.83. b. 1.10. c. 1.29. 32. An analyst held a 9% coupon bond for one year with the following results: Initial price 100% of par End of holding period price 98% of par The bond's total return for the one year holding period is closest to: a. 3.8%. b. 7.0% c. 10.2% 143 A stock with a coefficient of variation of 0.25 has an expected return equal to: a. Four times the stock's variance. b. Four times the stock's standard deviation. c. One-quarter of the stock's standard deviation. 144. A company must choose between two asset purchases. The annual rate of return and related probabilities are: Asset A PIReturn) 0.25 0.35 0.40 Return (%) 10 15 20 B 0.15 0.35 0.50 5 15 25 Which asset has the higher expected return? a. Asset A. A b. b Asset B. B c. They have the same expected return. 145. An analyst has developed a ratio to help forecast a decline in a company's EPS. The information for companies that actually have declining EPS when their ratio is negative, and companies that actually have no decline when their ratio is positive, are shown in the following table: Ratio Ratio Row negative positive total Companies with declining EPS 6 4 10 Companies with no decline 18 72 90 Column total 76 100 6 24 The analyst randomly selects a company and its ratio is negative. Based on Bayes' theorem, the updated probability that the company will experience an EPS decline next year is closest to: a. 6%. b. 25%. c. 33% 146. An investment strategy has an expected return of 16 percent with standard deviation of 14 percent. If investment returns are normally distributed, the probability of getting a return less than 2 percent is closest to: a. 16% b. 20% c. 34% 147. In evaluating the probability that only 40 percent of U.S. mutual funds contain bonds, an analyst takes a random sample of 1,000 funds from a mutual fund universe. The number of funds that have bonds in their portfolios is most accurately described as a: Discrete random variable. b. b. Binomial random variable. Multivariate random variable. a. C. 148. John Flomest collects the following statistical information regarding return on equity for a sample of U.S. companies. Sample Size 31 Population Size 515 Sample Mean 10% Sample Std. Dev. 15% Degrees of Freedom 30 Level of Significance 5% In estimating a confidence interval for average return on equity for all U.S. companies, Flomest will most likely use the: a. Sample mean only. b. Sample standard deviation only. c. Both the sample mean and the sample standard deviation. 149. A statistician develops the following chart representing decisions in hypothesis testing. Hoi True False Fall to Reject D B Reject A Which decision results in a Type II error? a. A b. B c. C 150. A firm's Risk Management Department (RMD) has, in the past, used a normal distribution to estimate a 5% probability of losing 20% or more in a given month. A new CFA charterholder analyzes the data and estimates that the distribution of bond excess returns on the bond portfolio has a skewness of zero and large positive excess kurtosis. Based on these findings, the RMD will most likely adjust their estimates of the probability of a loss > 20% as follows: a. Increase b. Decrease c. No adjustment is necessary if the skewness is zero
Step by Step Solution
There are 3 Steps involved in it

Get step-by-step solutions from verified subject matter experts