

Question: Quantitative Methods fx -05/013 Orange Wines Income Statement financial year ending 30 June 2019) 2019 2018 2017 '000 '000 '000 Sales 989 684 555 (less)
Quantitative Methods
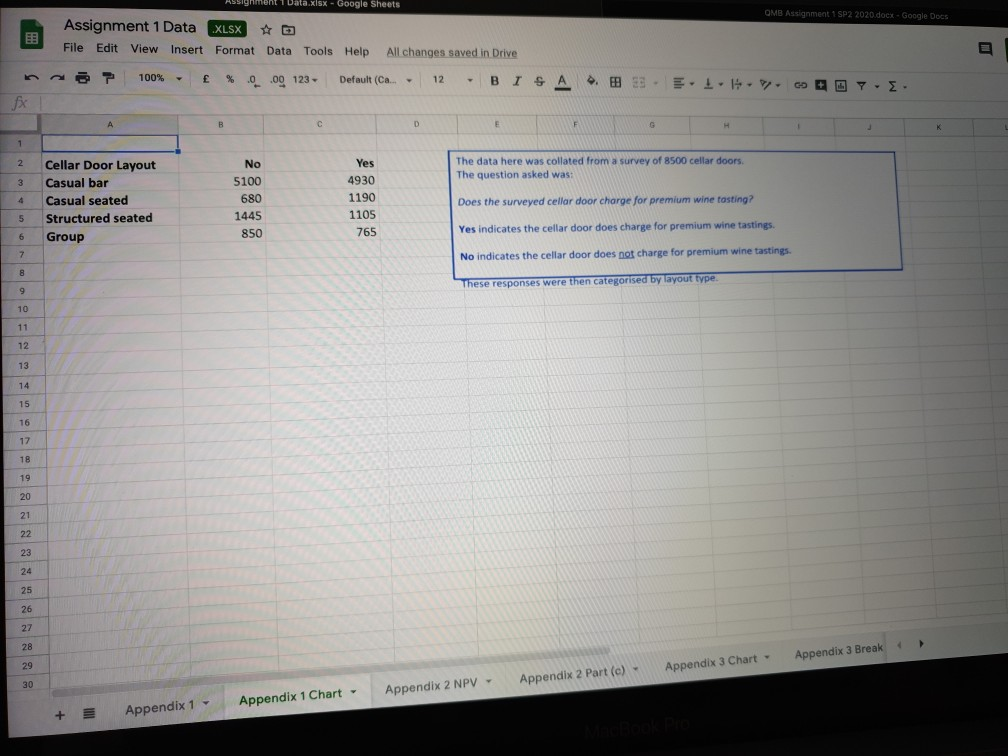
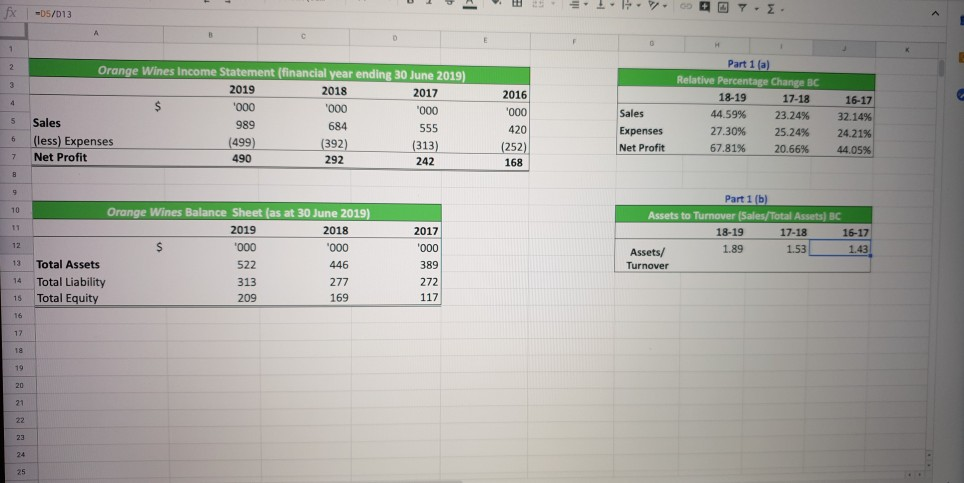
fx -05/013 Orange Wines Income Statement financial year ending 30 June 2019) 2019 2018 2017 '000 '000 '000 Sales 989 684 555 (less) Expenses (499) (392) (313) Net Profit 490 292 242 2016 '000 420 (252) 168 Part 1 (a) Relative Percentage Change BC 18-19 17-18 44.59% 23.24% 27.30% 25.24% 67.81% 20.66% Sales Expenses Net Profit 16-17 32.14% 24.21% 44,05% 2017 '000 16-17 1.43 Part 1 (b) Assets to Turnover (Sales/Total Assets) BC 18-19 17-18 Assets/ 1.89 1.53 Turnover Orange Wines Balance Sheet (as at 30 June 2019) 2019 2018 '000 '000 Total Assets 522 446 Total Liability 313 277 Total Equity 209 169 13 14 117 Assignment 1 Data.xlsx - Google Sheets QMB Assignment 1 SP2 2020.docx - Google Docs Assignment 1 Data XLSX File Edit View Insert Format Data Tools Help All changes saved in Drive > 100% - % 0.09 123 Default (ca . 12 -BI A . B . E I . CE Y E 2 The data here was collated from a survey of 8500 cellar doors. The question asked was: 3 Cellar Door Layout Casual bar Casual seated Structured seated Group No 5100 680 1445 850 Yes 4930 1190 1105 765 Does the surveyed cellar door charge for premium wine tasting? 5 6 Yes indicates the cellar door does charge for premium wine tastings. No indicates the cellar door does not charge for premium wine tastings These responses were then categorised by layout type. Appendix 3 Break Appendix 3 Chart Appendix 2 Part (0) Appendix 2 NPV Appendix 1 Chart Appendix 1 - fx -05/013 Orange Wines Income Statement financial year ending 30 June 2019) 2019 2018 2017 '000 '000 '000 Sales 989 684 555 (less) Expenses (499) (392) (313) Net Profit 490 292 242 2016 '000 420 (252) 168 Part 1 (a) Relative Percentage Change BC 18-19 17-18 44.59% 23.24% 27.30% 25.24% 67.81% 20.66% Sales Expenses Net Profit 16-17 32.14% 24.21% 44,05% 2017 '000 16-17 1.43 Part 1 (b) Assets to Turnover (Sales/Total Assets) BC 18-19 17-18 Assets/ 1.89 1.53 Turnover Orange Wines Balance Sheet (as at 30 June 2019) 2019 2018 '000 '000 Total Assets 522 446 Total Liability 313 277 Total Equity 209 169 13 14 117 Assignment 1 Data.xlsx - Google Sheets QMB Assignment 1 SP2 2020.docx - Google Docs Assignment 1 Data XLSX File Edit View Insert Format Data Tools Help All changes saved in Drive > 100% - % 0.09 123 Default (ca . 12 -BI A . B . E I . CE Y E 2 The data here was collated from a survey of 8500 cellar doors. The question asked was: 3 Cellar Door Layout Casual bar Casual seated Structured seated Group No 5100 680 1445 850 Yes 4930 1190 1105 765 Does the surveyed cellar door charge for premium wine tasting? 5 6 Yes indicates the cellar door does charge for premium wine tastings. No indicates the cellar door does not charge for premium wine tastings These responses were then categorised by layout type. Appendix 3 Break Appendix 3 Chart Appendix 2 Part (0) Appendix 2 NPV Appendix 1 Chart Appendix 1
Step by Step Solution
There are 3 Steps involved in it

Get step-by-step solutions from verified subject matter experts