

Question: Quantitative Methods RESM 3 0 1 Spring 2 0 2 4 Virtual Lab ( % 2 0 ) : ( USE ONLY EXCEL SHEET FOR
Quantitative Methods RESM
Spring
Virtual Lab :
USE ONLY EXCEL SHEET FOR DATA, FORMULAS, and the GRAPHS
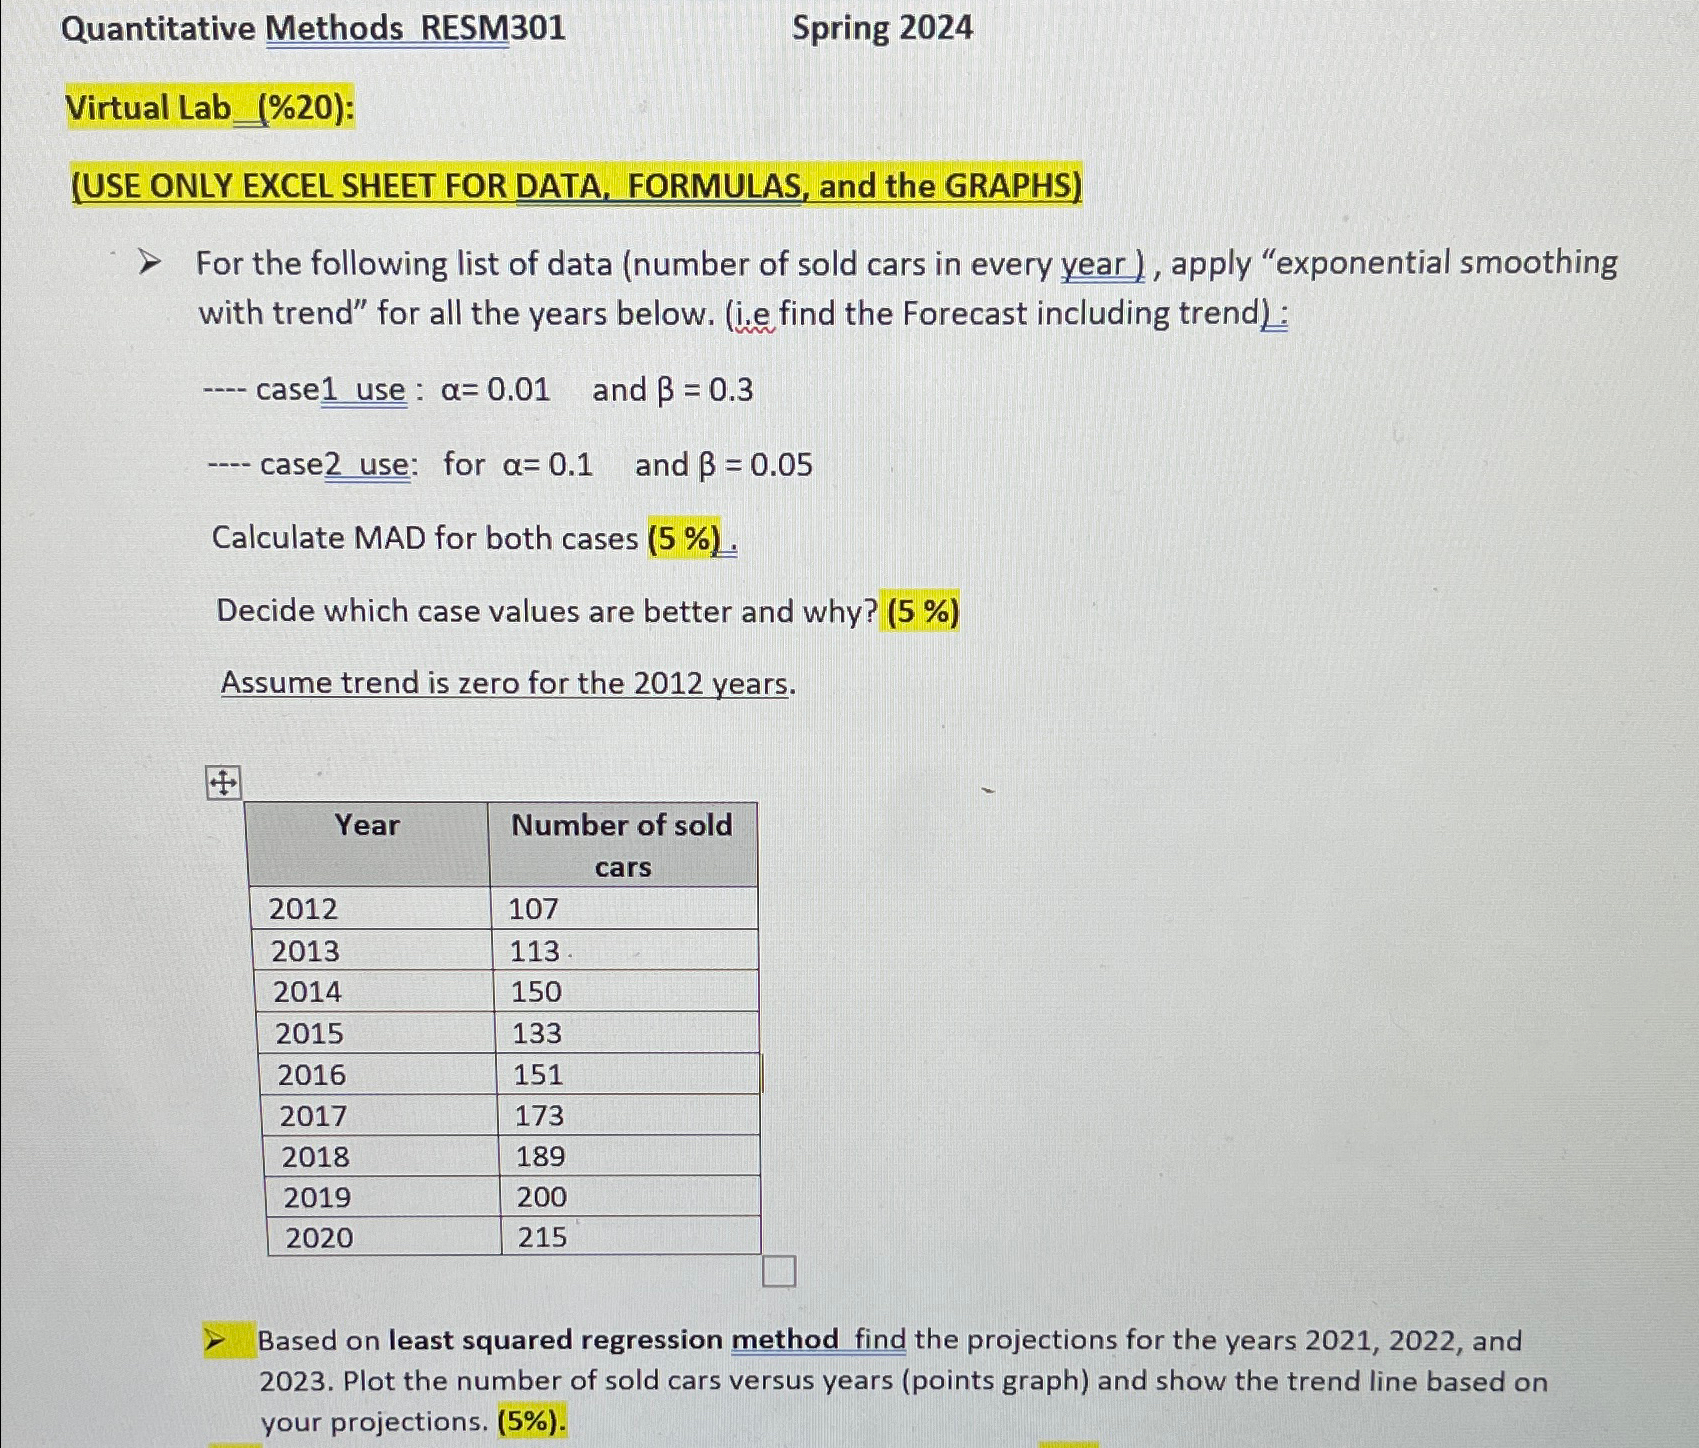
For the following list of data number of sold cars in every year apply "exponential smoothing with trend" for all the years below. ie find the Forecast including trend:
case use: and
case use: for and
Calculate MAD for both cases
Decide which case values are better and why?
Assume trend is zero for the years.
tableYeartableNumber of soldcars
Based on least squared regression method find the projections for the years and Plot the number of sold cars versus years points graph and show the trend line based on your projections.
Step by Step Solution
There are 3 Steps involved in it
1 Expert Approved Answer
Step: 1 Unlock

Question Has Been Solved by an Expert!
Get step-by-step solutions from verified subject matter experts
Step: 2 Unlock
Step: 3 Unlock