

Question: Quantitative Problem: Bellinger Industries is considering two projects for inclusion in its capital budget, and you have been asked to do the analysis. Both projects
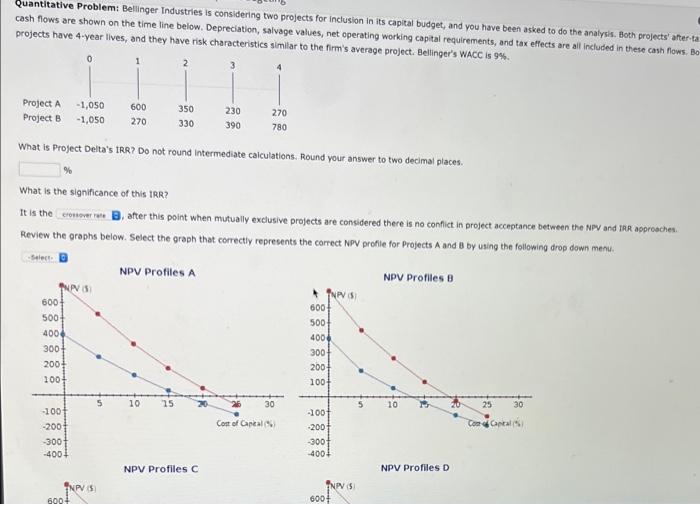
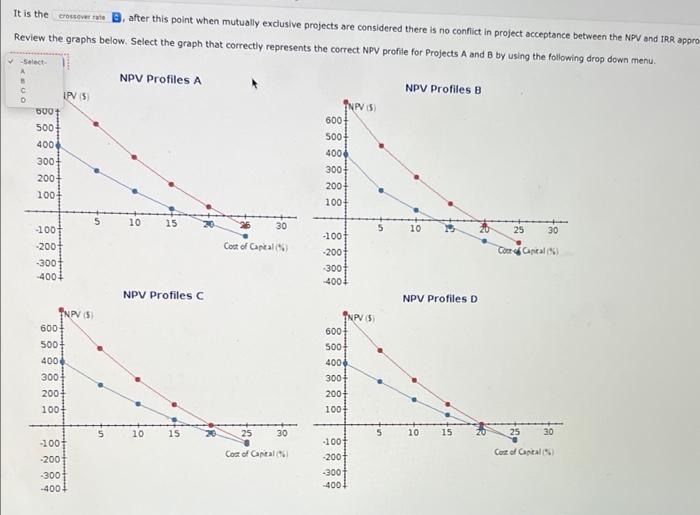
Quantitative Problem: Bellinger Industries is considering two projects for inclusion in its capital budget, and you have been asked to do the analysis. Both projects after ta cash flows are shown on the time line below. Depreciation, salvage values, net operating working capital requirements, and tax effects are all included in these cash flows. Bo projects have 4-year lives, and they have risk characteristics similar to the firm's average project. Bellinger's WACC is 9%. 0 1 2 Project A Project B -1,050 -1,050 600 270 350 330 230 390 270 780 What is Project Delta's IRR? Do not round Intermediate calculations. Round your answer to two decimal places. What is the significance of this TAR? It is the crossover after this point when mutually exclusive projects are considered there is no conflict in project acceptance between the NPV and PAR approaches. Review the graphs below. Select the graph that correctly represents the correct NPV profile for Projects A and B by using the following drop down menu. NPV Profiles A NPV Profiles 8 Stect TNPS 6001 500 400 300 200 6001 500 4004 300 200 100+ 1004 5 10 15 30 10 25 30 Cost of Captal Como Captal -1004 -2004 -300 -4001 -100- 200 -3001 4001 NPV Profiles C NPV Profiles D NPVA NPV 5 600+ 6004 It is the create after this point when mutually exclusive projects are considered there is no conflict in project acceptance between the NPV and TRR appro Review the graphs below. Select the graph that correctly represents the correct NPV profile for Projects A and B by using the following drop down menu. -Select NPV Profiles A C O NPV Profiles B IPV 5 600+ 500 400 300 200 INPV 5 600+ 500 4004 300 200 100 100 5 10 15 30 25 30 -1004 -2007 -300 -400+ Cort of Ganeales Conta Carral) -100 -200 300 -400 NPV Profiles NPV Profiles D INPS 600 500+ 400 3004 TNPV 5 600 500 4004 3004 200 100 200 1004 6 10 15 25 30 5 10 15 25 30 100 -200 Cost of Captal Cost of Captal -100+ -200 -300 .400 -300 -400
Step by Step Solution
There are 3 Steps involved in it
To solve the problem we need to determine the IRR Internal Rate of Return and NPV Net Present Value profiles for Projects A and B as described We will ... View full answer

Get step-by-step solutions from verified subject matter experts