

Question: Quantitative reasoning 3:36 ivylearn.ivytech.edu D Question 5 3 pts Which best describes the slope of the trendline pictured? Disney+ Subscriptions, REGION 4 600 y =
Quantitative reasoning
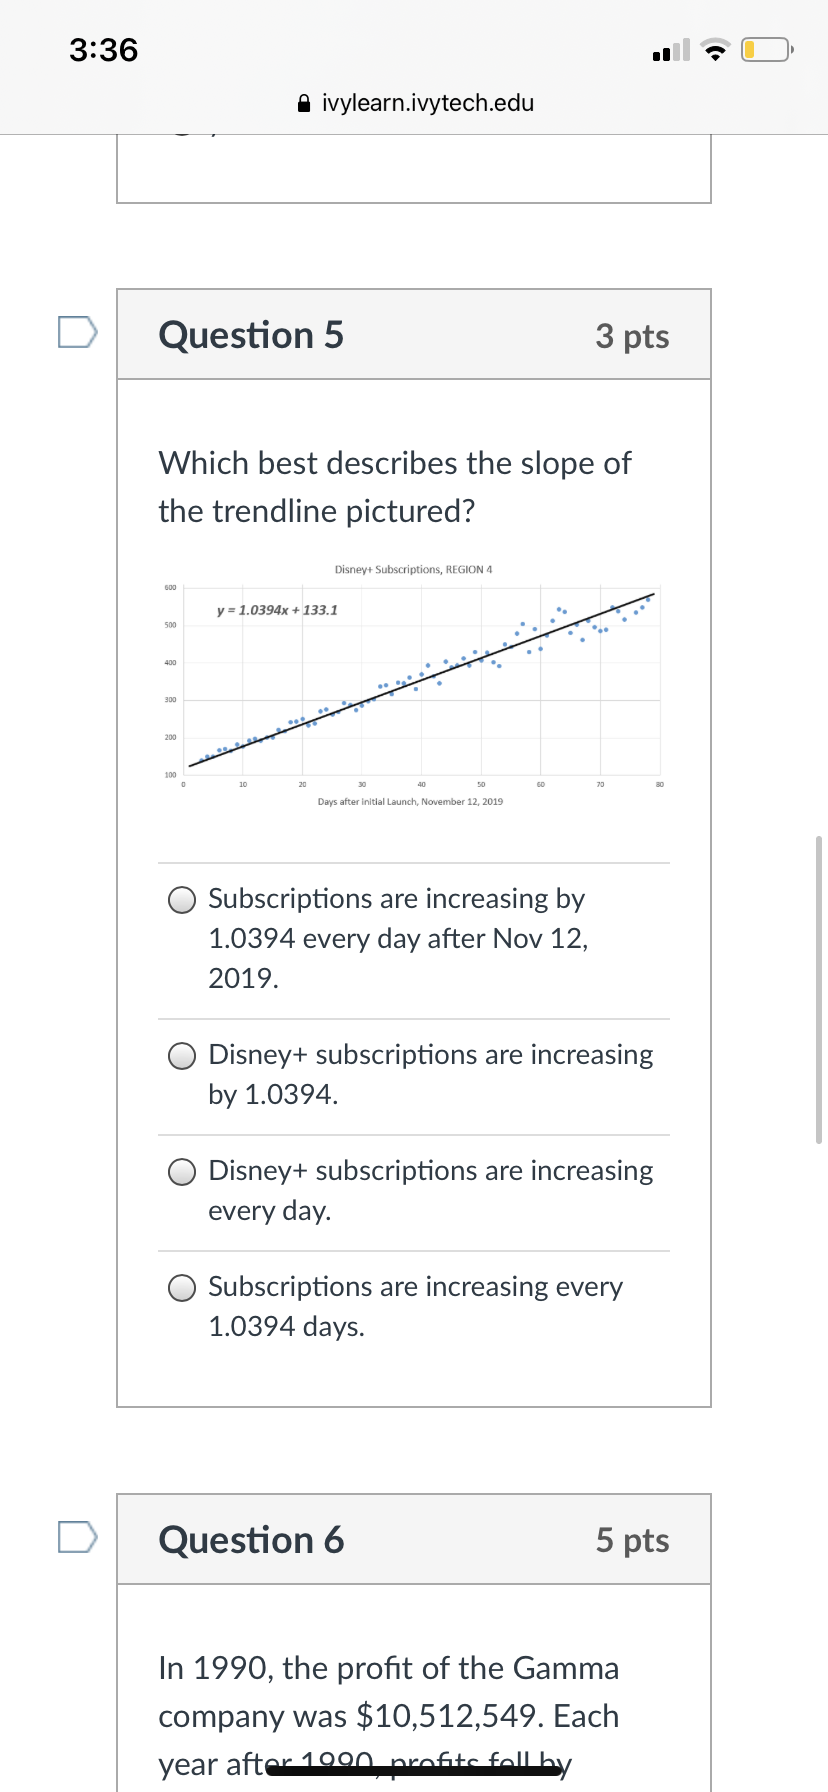
3:36 ivylearn.ivytech.edu D Question 5 3 pts Which best describes the slope of the trendline pictured? Disney+ Subscriptions, REGION 4 600 y = 1.0394x + 133.1 500 400 300 200 100 60 Days after initial Launch, November 12, 2019 O Subscriptions are increasing by 1.0394 every day after Nov 12, 2019. O Disney+ subscriptions are increasing by 1.0394. O Disney+ subscriptions are increasing every day. O Subscriptions are increasing every 1.0394 days. D Question 6 5 pts In 1990, the profit of the Gamma company was $10,512,549. Each year after 1900 profits fall by
Step by Step Solution
There are 3 Steps involved in it
1 Expert Approved Answer
Step: 1 Unlock

Question Has Been Solved by an Expert!
Get step-by-step solutions from verified subject matter experts
Step: 2 Unlock
Step: 3 Unlock