

Question: Quantitative studies data, at least and at most dont know how to do bJ The following frequency distribution shows the daily allow ances (to the
Quantitative studies data, at least and at most dont know how to do
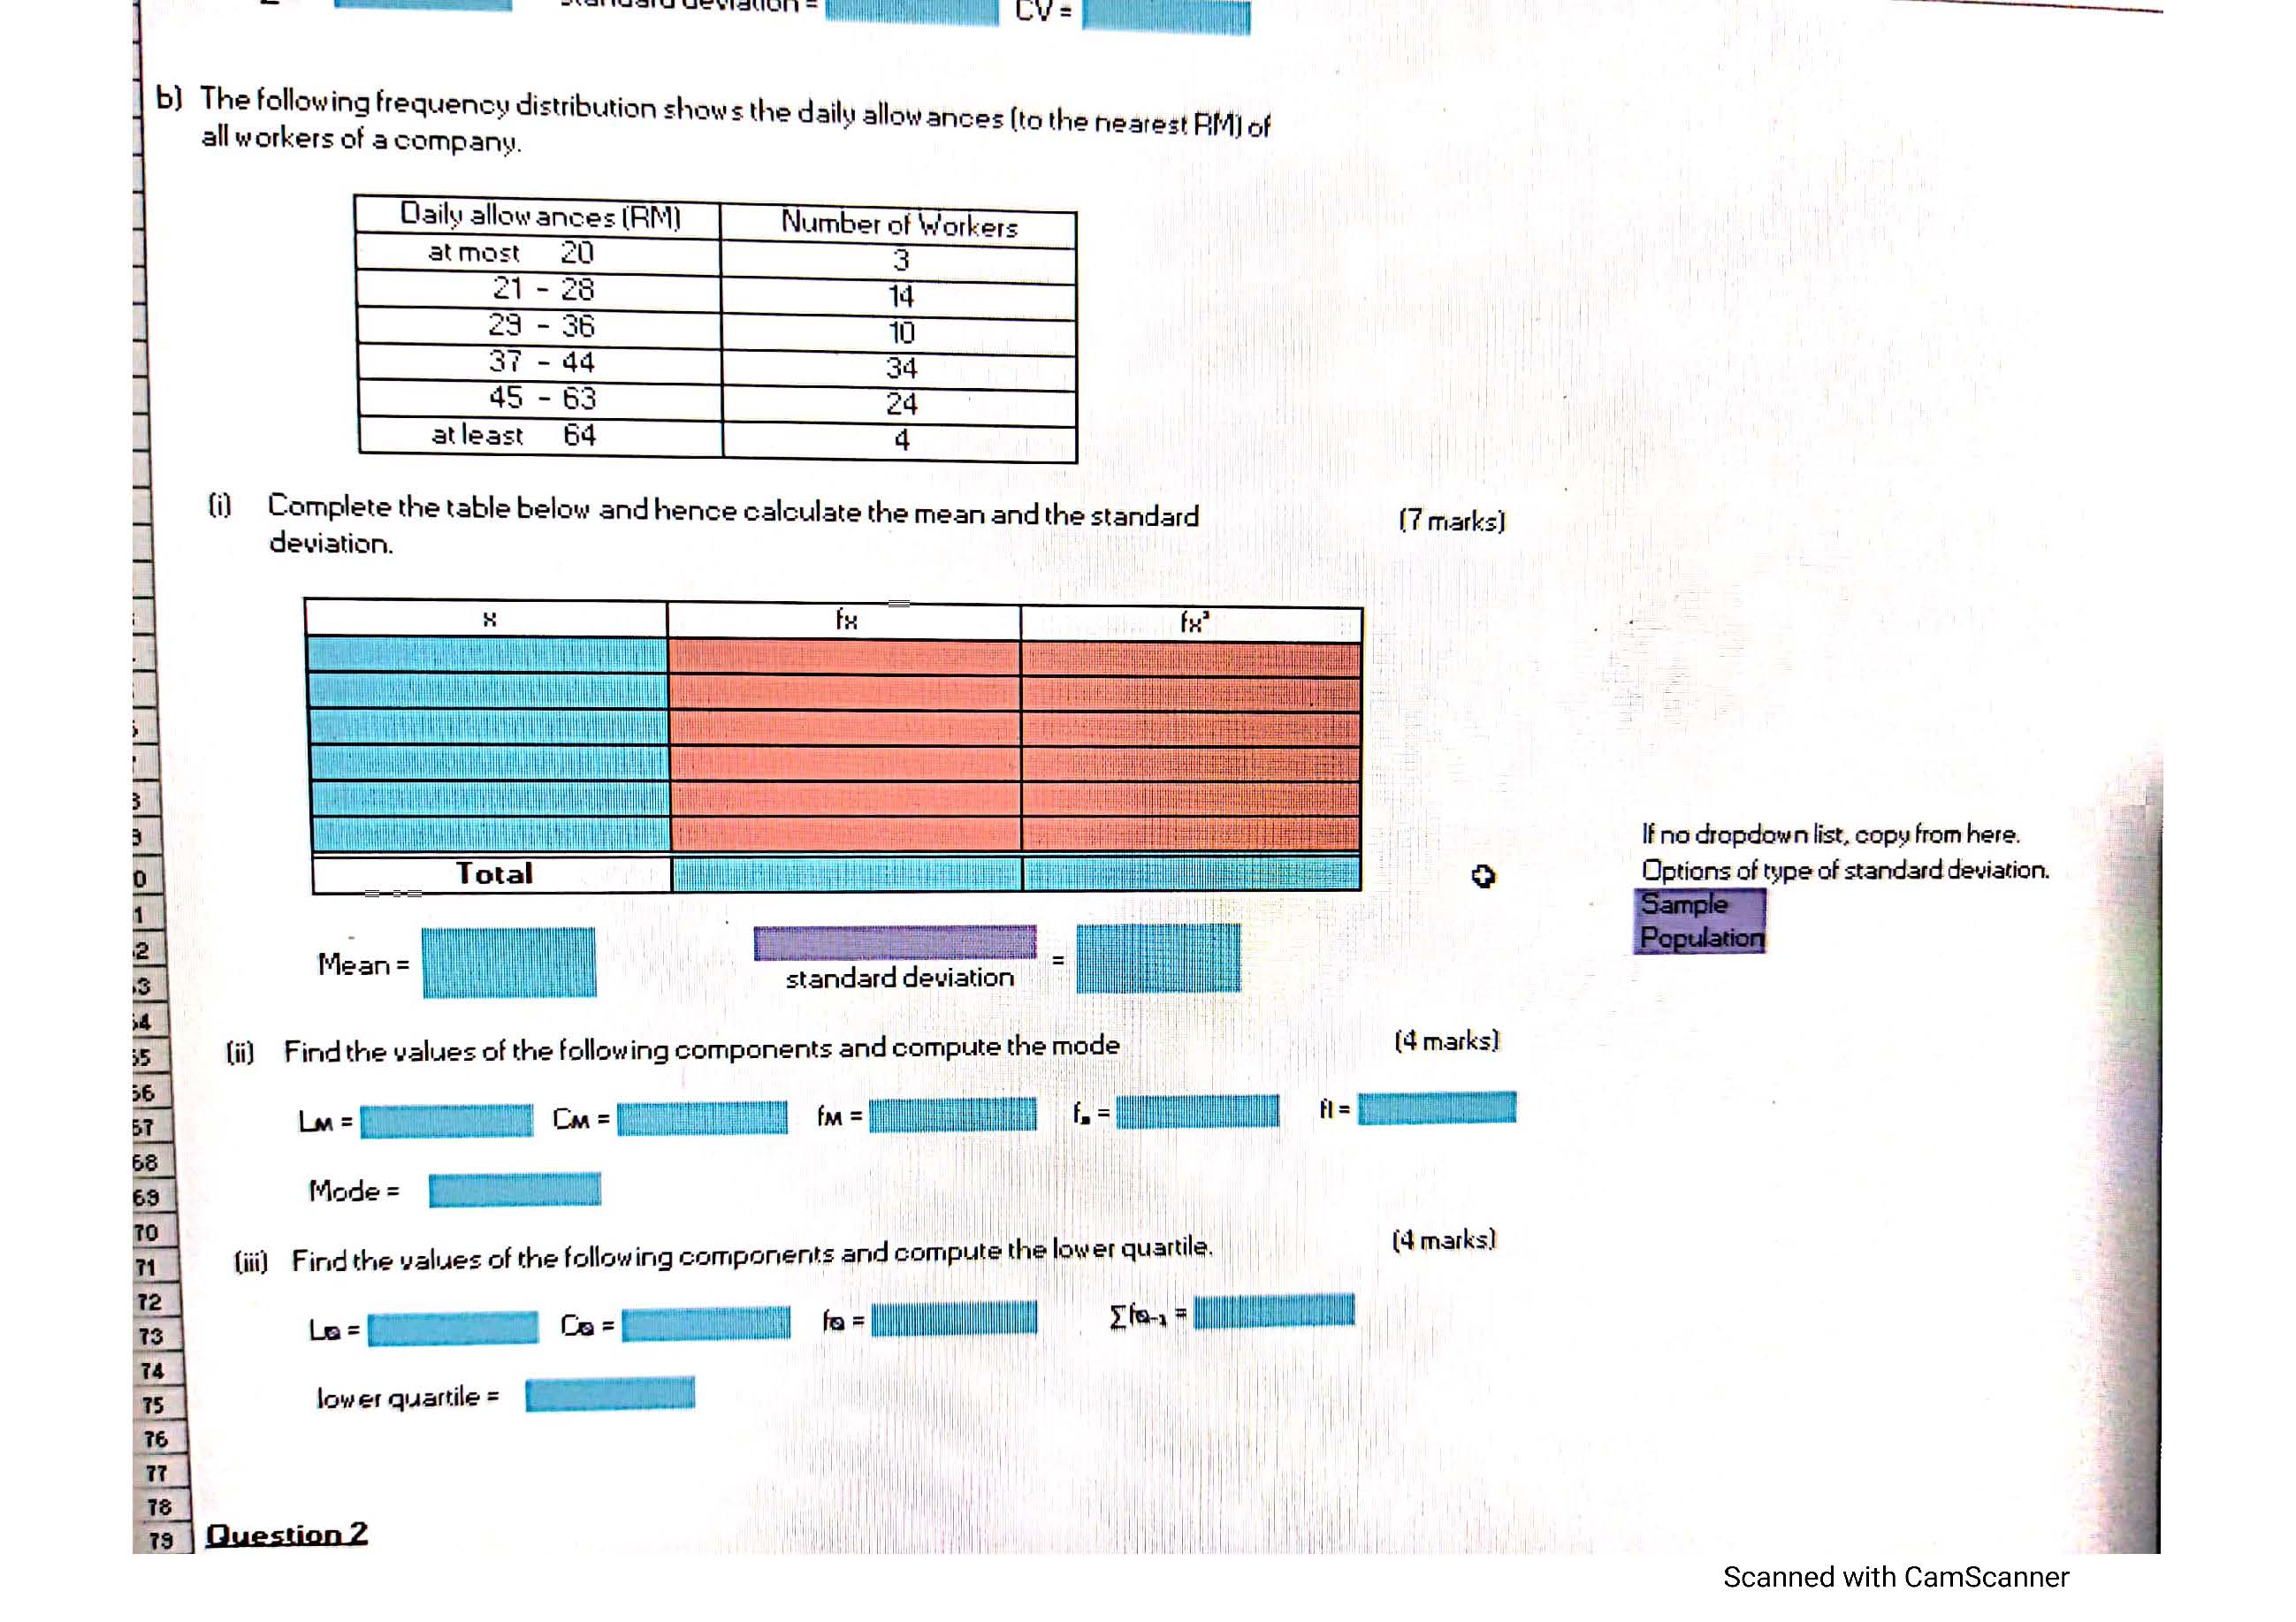
bJ The following frequency distribution shows the daily allow ances (to the nearest RM] of all workers of a company. Daily allow ances (RM) Number of Workers at most 20 3 21 - 28 14 29 - 36 10 37 - 44 34 15 - 63 24 at least 64 4 (i) Complete the table below and hence calculate the mean and the standard deviation. (7 marks] fx If no dropdown list, copy from here. Total Options of type of standard deviation. Sample Population Mean = standard deviation [ii) Find the values of the following components and compute the mode (4 marks] LM = CM = 1 = Mode = (ii) Find the values of the following components and compute the lower quartile. (4 marks) Lo = Ca = 75 lower quartile = 76 77 78 79 Question 2 Scanned with CamScanner
Step by Step Solution
There are 3 Steps involved in it

Get step-by-step solutions from verified subject matter experts