

Question: Quantitative variables usually represent membership in groups or categories. Bar and pie charts are graphical techniques for nominal data. The former focus the attention on
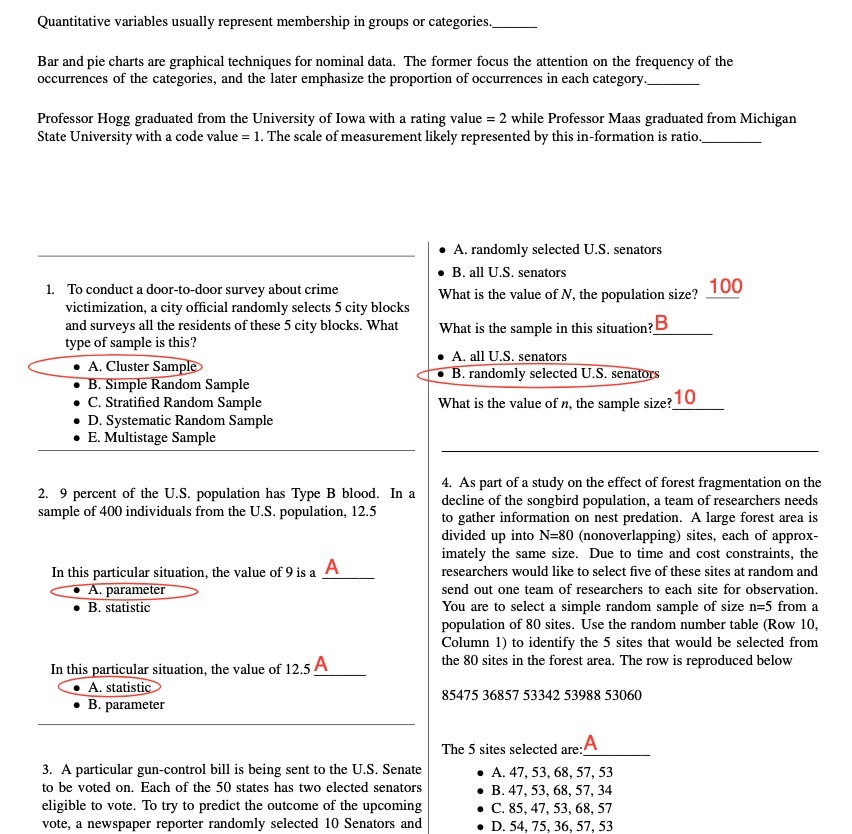
Quantitative variables usually represent membership in groups or categories. Bar and pie charts are graphical techniques for nominal data. The former focus the attention on the frequency of the occurrences of the categories, and the later emphasize the proportion of occurrences in each category. Professor Hogg graduated from the University of Iowa with a rating value = 2 while Professor Maas graduated from Michigan State University with a code value = 1. The scale of measurement likely represented by this in-formation is ratio._ . A. randomly selected U.S. senators . B. all U.S. senators 1. To conduct a door-to-door survey about crime victimization, a city official randomly selects 5 city blocks What is the value of N, the population size? 100 and surveys all the residents of these 5 city blocks. What ype of sample is this ? What is the sample in this situation? B . A. Cluster Sample . A. all U.S. senators B. Simple Random Sample B. randomly selected U.S. senators . C. Stratified Random Sample What is the value of n, the sample size? 10 . D. Systematic Random Sample . E. Multistage Sample 2. 9 percent of the U.S. population has Type B blood. In a 4. As part of a study on the effect of forest fragmentation on the sample of 400 individuals from the U.S. population, 12.5 decline of the songbird population, a team of researchers needs to gather information on nest predation. A large forest area is divided up into N=80 (nonoverlapping) sites, each of approx- imately the same size. Due to time and cost constraints, the In this particular situation, the value of 9 is a A researchers would like to select five of these sites at random and A. parameter send out one team of researchers to each site for observation. . B. statistic You are to select a simple random sample of size n=5 from a population of 80 sites. Use the random number table (Row 10, Column 1) to identify the 5 sites that would be selected from In this particular situation, the value of 12.5 A the 80 sites in the forest area. The row is reproduced below A. statistic . B. parameter 85475 36857 53342 53988 53060 The 5 sites selected are: A 3. A particular gun-control bill is being sent to the U.S. Senate . A. 47, 53, 68, 57, 53 to be voted on. Each of the 50 states has two elected senators . B. 47, 53, 68, 57, 34 eligible to vote. To try to predict the outcome of the upcoming . C. 85, 47, 53, 68, 57 vote, a newspaper reporter randomly selected 10 Senators and D. 54, 75, 36, 57, 53
Step by Step Solution
There are 3 Steps involved in it

Get step-by-step solutions from verified subject matter experts