

Question: Quantity Variable Cost Total Cost Marginal Cost Average Variable Cost Average Total Cost (Vats of juice) (Dollars) (Dollars) (Dollars) (Dollars) (Dollars) D 30 10 40

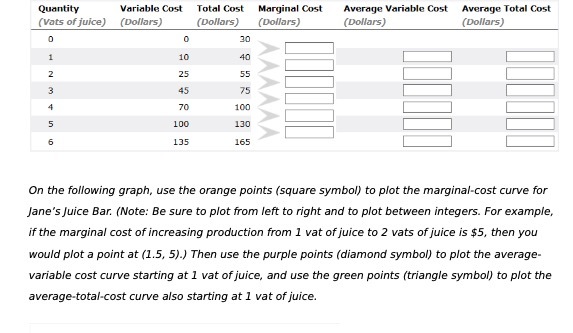
Quantity Variable Cost Total Cost Marginal Cost Average Variable Cost Average Total Cost (Vats of juice) (Dollars) (Dollars) (Dollars) (Dollars) (Dollars) D 30 10 40 W N 25 55 45 75 70 100 100 130 135 165 On the following graph, use the orange points (square symbol) to plot the marginal-cost curve for Jane's Juice Bar. (Note: Be sure to plot from left to right and to plot between integers. For example, if the marginal cost of increasing production from 1 vat of juice to 2 vats of juice is $5, then you would plot a point at (1.5, 5).) Then use the purple points (diamond symbol) to plot the average- variable cost curve starting at 1 vat of juice, and use the green points (triangle symbol) to plot the average-total-cost curve also starting at 1 vat of juice
Step by Step Solution
There are 3 Steps involved in it

Get step-by-step solutions from verified subject matter experts