

Question: Ques Here are comparative statement data for Pharoah Company and Cullumber Company, two competitors. All balance sheet data are as of December 31, 2020, and
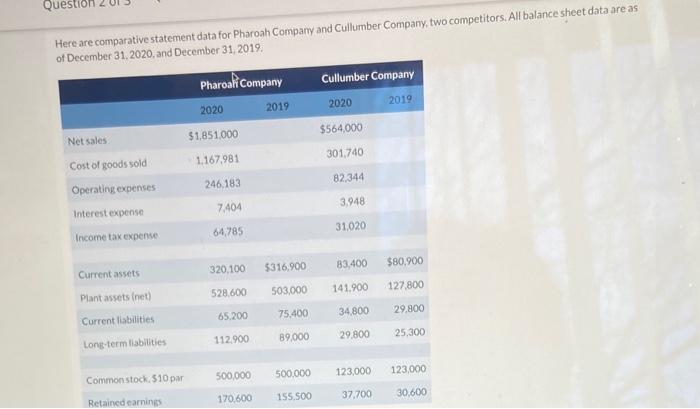
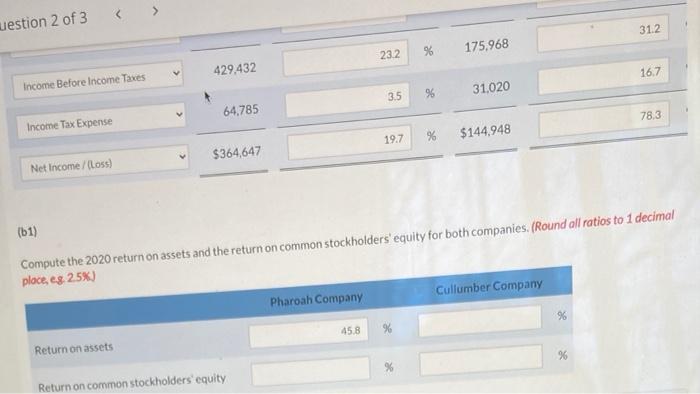
Ques Here are comparative statement data for Pharoah Company and Cullumber Company, two competitors. All balance sheet data are as of December 31, 2020, and December 31, 2019. Cullumber Company Pharoal Company 2019 2020 2019 2020 $564.000 $1,851.000 Net sales 301.740 1.167.981 Cost of goods sold Operating expenses 82 344 246.183 3.948 7.404 Interest expense 31.020 64,785 Income tax expense $316,900 83.400 $80.900 320.100 503,000 528600 141.900 127.800 Current assets Plant assets (net) Current liabilities Long-term liabilities 75.400 65.200 34 800 29.800 89,000 29.800 112.900 25.300 500.000 500,000 123,000 123,000 Common stock 510 par 155.500 170.600 37.700 30.600 Retained earnings estion 2 of 3 312 232 de % 175.968 429,432 16.7 Income Before Income Taxes 35 96 % 31,020 64,785 783 Income Tax Expense 19.7 % $144.948 $364,647 Net Income /(Loss) (51) Compute the 2020 return on assets and the return on common stockholders equity for both companies. (Round all ratios to 1 decimal place, es 2.5%) Cullumber Company Pharoah Company 95 45.8 % Return on assets % Return on common stockholders equity
Step by Step Solution
There are 3 Steps involved in it

Get step-by-step solutions from verified subject matter experts