

Question: Question 01 Given below is hypothetical data on two stocks on the LUSE and the market data (All Lusaka Share Index). The market data already
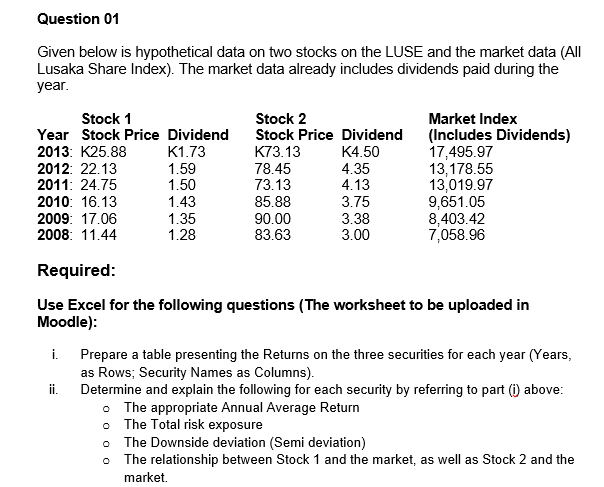
Question 01 Given below is hypothetical data on two stocks on the LUSE and the market data (All Lusaka Share Index). The market data already includes dividends paid during the year. Stock 1 Year Stock Price Dividend 2013: K25.88 K1.73 2012: 22.13 1.59 2011: 24.75 1.50 2010: 16.13 1.43 2009: 17.06 1.35 2008: 11.44 1.28 Stock 2 Stock Price Dividend K73.13 K4.50 78.45 4.35 73.13 4.13 85.88 3.75 90.00 3.38 83.63 3.00 Market Index (Includes Dividends) 17,495.97 13,178.55 13,019.97 9,651.05 8,403.42 7,058.96 Required: Use Excel for the following questions (The worksheet to be uploaded in Moodle): i. Prepare a table presenting the Returns on the three securities for each year (Years, as Rows; Security Names as Columns). ii. Determine and explain the following for each security by referring to part (1) above: o The appropriate Annual Average Return o The Total risk exposure The Downside deviation (Semi deviation) The relationship between Stock 1 and the market, as well as Stock 2 and the market. O Question 01 Given below is hypothetical data on two stocks on the LUSE and the market data (All Lusaka Share Index). The market data already includes dividends paid during the year. Stock 1 Year Stock Price Dividend 2013: K25.88 K1.73 2012: 22.13 1.59 2011: 24.75 1.50 2010: 16.13 1.43 2009: 17.06 1.35 2008: 11.44 1.28 Stock 2 Stock Price Dividend K73.13 K4.50 78.45 4.35 73.13 4.13 85.88 3.75 90.00 3.38 83.63 3.00 Market Index (Includes Dividends) 17,495.97 13,178.55 13,019.97 9,651.05 8,403.42 7,058.96 Required: Use Excel for the following questions (The worksheet to be uploaded in Moodle): i. Prepare a table presenting the Returns on the three securities for each year (Years, as Rows; Security Names as Columns). ii. Determine and explain the following for each security by referring to part (1) above: o The appropriate Annual Average Return o The Total risk exposure The Downside deviation (Semi deviation) The relationship between Stock 1 and the market, as well as Stock 2 and the market. O
Step by Step Solution
There are 3 Steps involved in it

Get step-by-step solutions from verified subject matter experts