

Question: Question 1 (0.5 points} Suppose we have a data set with quantitative variables X and V. as well as a Categorical variable Group {Group A,
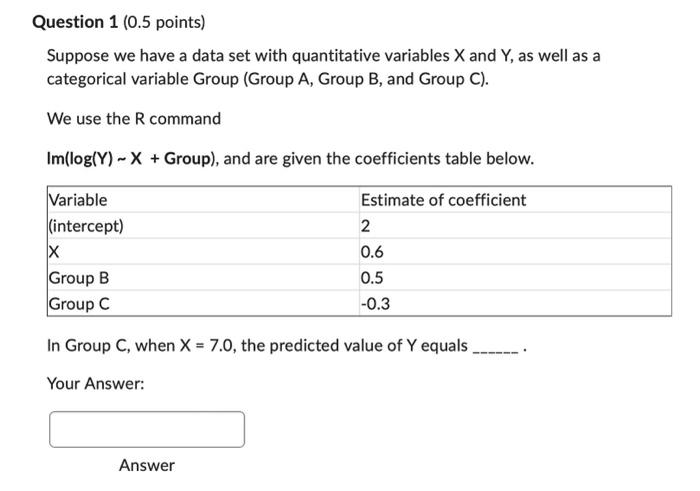
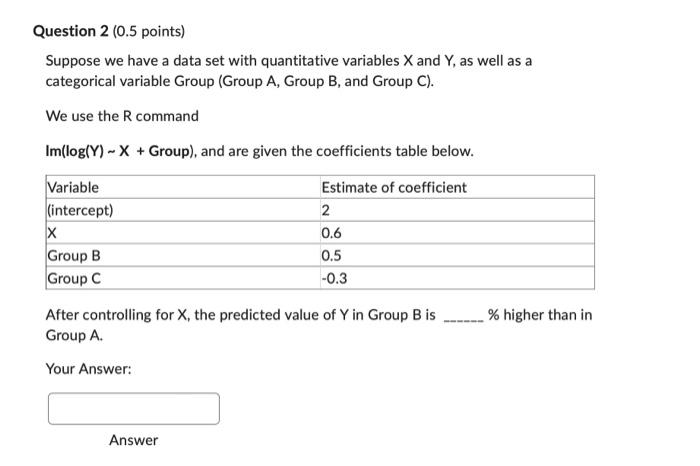
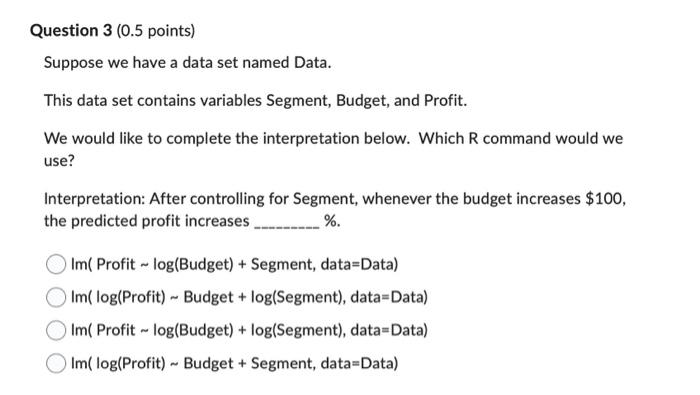
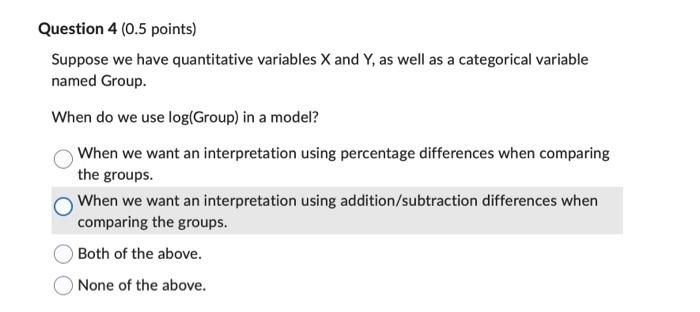
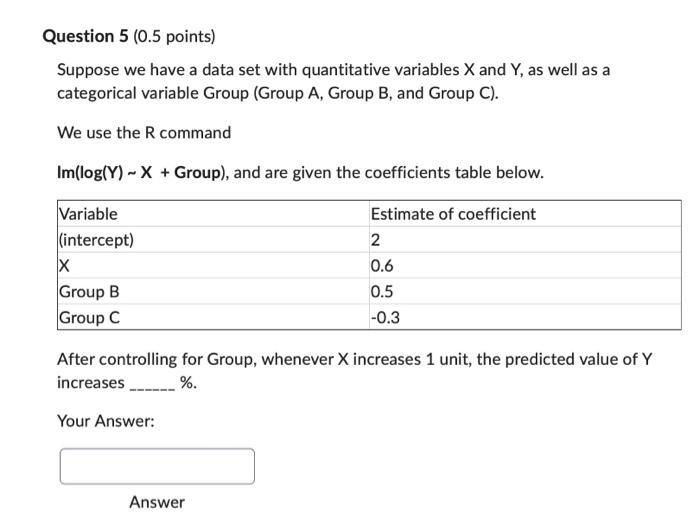
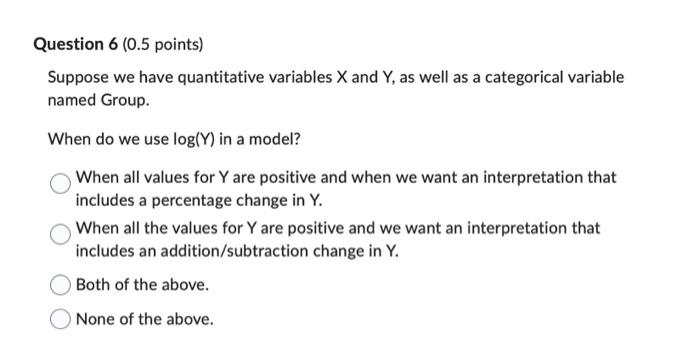
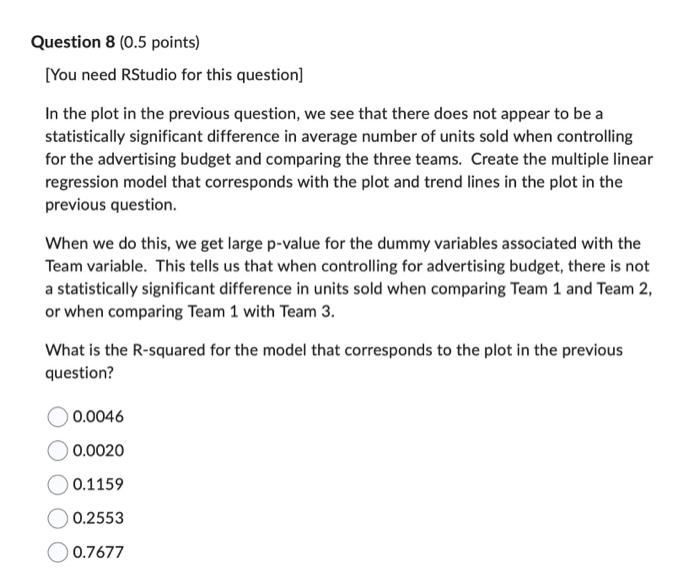
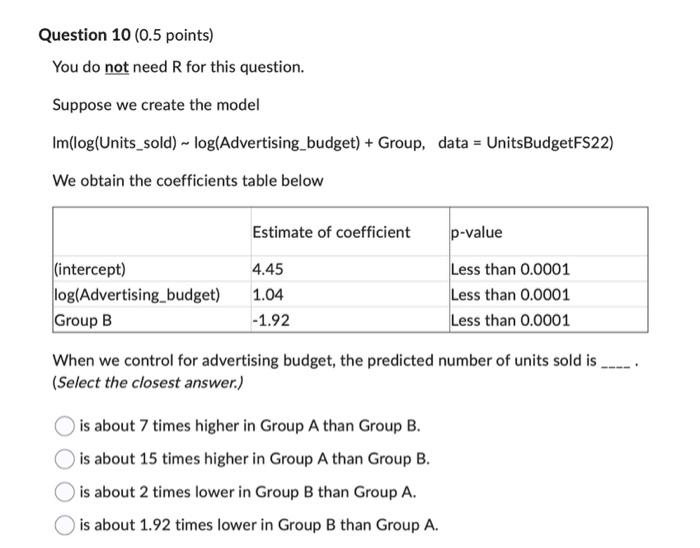
Question 1 (0.5 points} Suppose we have a data set with quantitative variables X and V. as well as a Categorical variable Group {Group A, Group B, and Group C}. We use the R command Imilogi'r'} ... X + Group}, and are given the coefficients table below. Estimate of coefficient 2 0.6 0.5 43.3 In Group C. when X = 10. the predicted value of'fcouals . Your Answer: Answer Question 2 (0.5 points) Suppose we have a data set with quantitative variables X and Y, as well as a categorical variable Group (Group A, Group B, and Group C). We use the R command Im(log(Y) ~ X + Group), and are given the coefficients table below. Variable Estimate of coefficient (intercept) 2 X 0.6 Group B 0.5 Group C -0.3 After controlling for X, the predicted value of Y in Group B is % higher than in Group A. Your Answer: AnswerQuestion 3 (0.5 points) Suppose we have a data set named Data. This data set contains variables Segment, Budget, and Profit. We would like to complete the interpretation below. Which R command would we use? Interpretation: After controlling for Segment, whenever the budget increases $100, the predicted profit increases %. Im( Profit ~ log(Budget) + Segment, data=Data) Im( log(Profit) ~ Budget + log(Segment), data=Data) Im( Profit - log(Budget) + log(Segment), data=Data) Im( log(Profit) ~ Budget + Segment, data=Data)Question 4 (0.5 points) Suppose we have quantitative variables X and Y, as well as a categorical variable named Group. When do we use log(Group) in a model? When we want an interpretation using percentage differences when comparing the groups. When we want an interpretation using addition/subtraction differences when comparing the groups. O Both of the above. None of the above.Question 5 (0.5 points]I Suppose we have a data set with quantitative variables X and 'f. as well as a categorical variable Group l[Group A. Group B, and Group G}. We use the R command imllogi'f} - )t + Group}, and are given the coefficients table below. Estimate of coefficient 2 0.6 '15 43.3 After controlling for Group. whenever 1K increases 1 unit, the predicted value of Y increases 9-3. Your Answer: Answer Question 6 (0.5 points) Suppose we have quantitative variables X and Y, as well as a categorical variable named Group. When do we use log(Y) in a model? O When all values for Y are positive and when we want an interpretation that includes a percentage change in Y. O When all the values for Y are positive and we want an interpretation that includes an addition/subtraction change in Y. O Both of the above. None of the above.Question 8 (0.5 points) [You need RStudio for this question] In the plot in the previous question, we see that there does not appear to be a statistically significant difference in average number of units sold when controlling for the advertising budget and comparing the three teams. Create the multiple linear regression model that corresponds with the plot and trend lines in the plot in the previous question. When we do this, we get large p-value for the dummy variables associated with the Team variable. This tells us that when controlling for advertising budget, there is not a statistically significant difference in units sold when comparing Team 1 and Team 2, or when comparing Team 1 with Team 3. What is the R-squared for the model that corresponds to the plot in the previous question? 0.0046 0.0020 0.1159 0.2553 0.7677Question 10 (0.5 points) You do not need R for this question. Suppose we create the model Im(log(Units_sold) ~ log(Advertising_budget) + Group, data = UnitsBudgetFS22) We obtain the coefficients table below Estimate of coefficient p-value (intercept) 4.45 Less than 0.0001 log(Advertising_budget) 1.04 Less than 0.0001 Group B -1.92 Less than 0.0001 When we control for advertising budget, the predicted number of units sold is (Select the closest answer.) O is about 7 times higher in Group A than Group B. O is about 15 times higher in Group A than Group B. is about 2 times lower in Group B than Group A. is about 1.92 times lower in Group B than Group A
Step by Step Solution
There are 3 Steps involved in it

Get step-by-step solutions from verified subject matter experts