

Question: Question 1 (1 point) What is the approximate value at the 23rd percentile for the data shown? 36 40 43 45 48 48 50 50
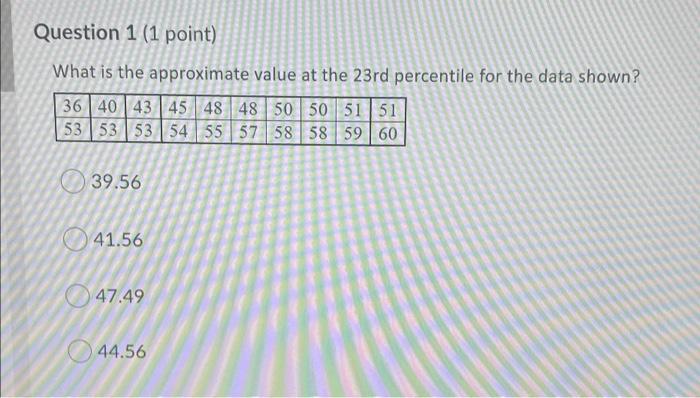
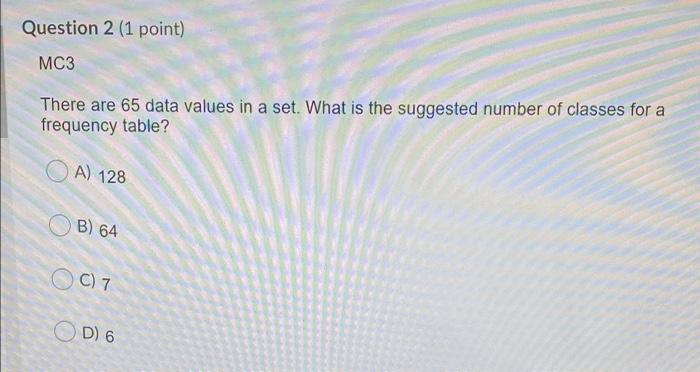
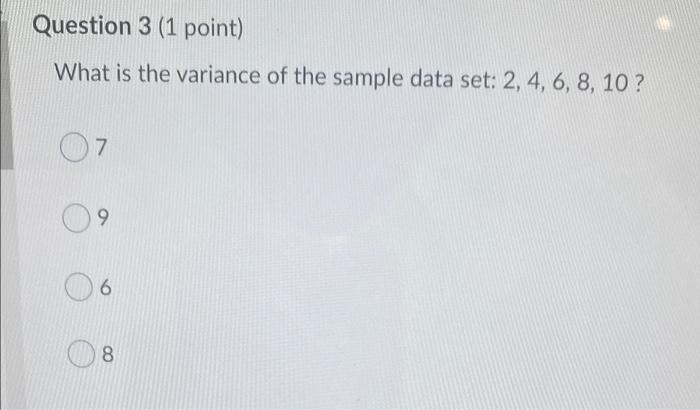
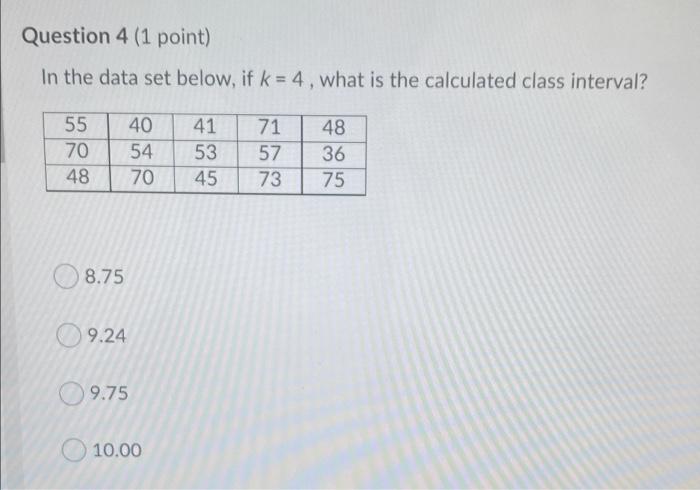
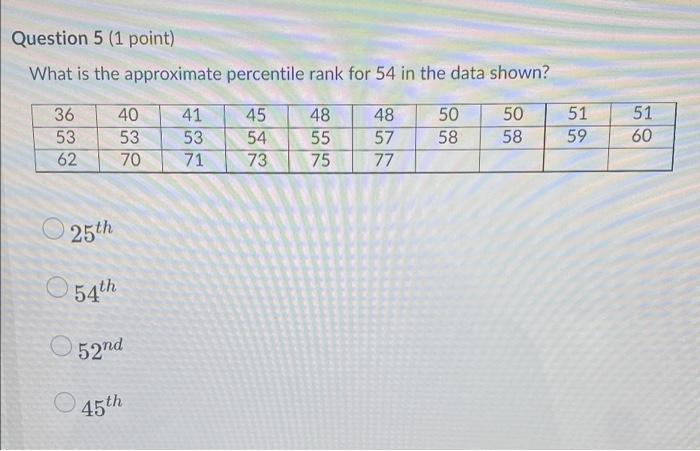
Question 1 (1 point) What is the approximate value at the 23rd percentile for the data shown? 36 40 43 45 48 48 50 50 51 51 53 53 53 54 55 57 58 58 59 60 39.56 41.56 47.49 44.56 Question 2 (1 point) MC3 There are 65 data values in a set. What is the suggested number of classes for a frequency table? A) 128 B) 64 OC7 C) 7 OD 6 Question 3 (1 point) What is the variance of the sample data set: 2, 4, 6, 8, 10 ? 7 9 6 8 Question 4 (1 point) In the data set below, if k = 4, what is the calculated class interval? 55 70 48 40 54 70 41 53 45 71 57 73 48 36 75 8.75 9.24 9.75 10.00 Question 5 (1 point) What is the approximate percentile rank for 54 in the data shown? 36 40 53 70 53 41 53 45 54 48 55 48 57 50 58 50 58 51 59 51 60 62 71 73 75 77 25th 54th 52nd 45th
Step by Step Solution
There are 3 Steps involved in it

Get step-by-step solutions from verified subject matter experts