

Question: Question 1 1 points Save Arawer The table below gives data on the monthly returns on the S&P 500 and small cap stocks for the
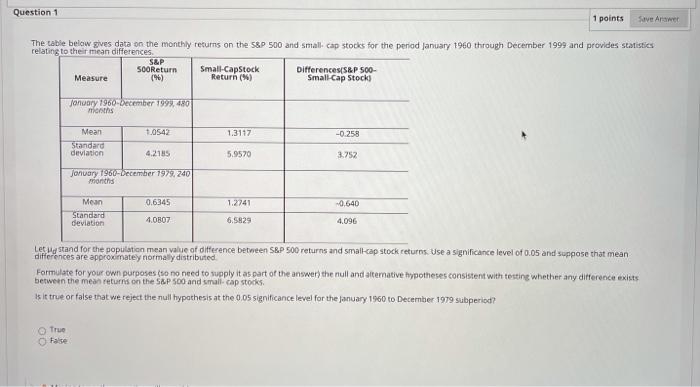
Question 1 1 points Save Arawer The table below gives data on the monthly returns on the S&P 500 and small cap stocks for the period January 1960 through December 1999 and provides statistics relating to their mean differences S&P SOOReturn Small-CapStock Differences(S&P 500- Measure (%) Return (4) Small-Cap Stock) January 1960-December 1999, 480 nionths 1.0542 1.3117 -0.258 Mean Standard deviation 4,2185 5.9570 3.752 January 1960-December 199,240 months Mean 0.6345 1.2741 0.640 Standard deviation 4.0807 6.5829 4.096 Leto stand for the population mean value of difference between S&P 500 returns and small-cap stock returns Use a significance level of 0.05 and suppose that mean differences are approximatey normally distributed Formulate for your own purposes (to no need to supply it as part of the answer the null and alternative hypotheses consistent with testing whether any difference exists between the mean returns on the S&P 500 and small cap stocks s le true or false that we reject the null hypothesis at the 0.05 significance level for the January 1960 to December 1979 subperiod? True False
Step by Step Solution
There are 3 Steps involved in it

Get step-by-step solutions from verified subject matter experts