

Question: Question 1 1 pts Suppose we are given a random sample of n=64 observations from a population with finite variance. This sample produced a sample
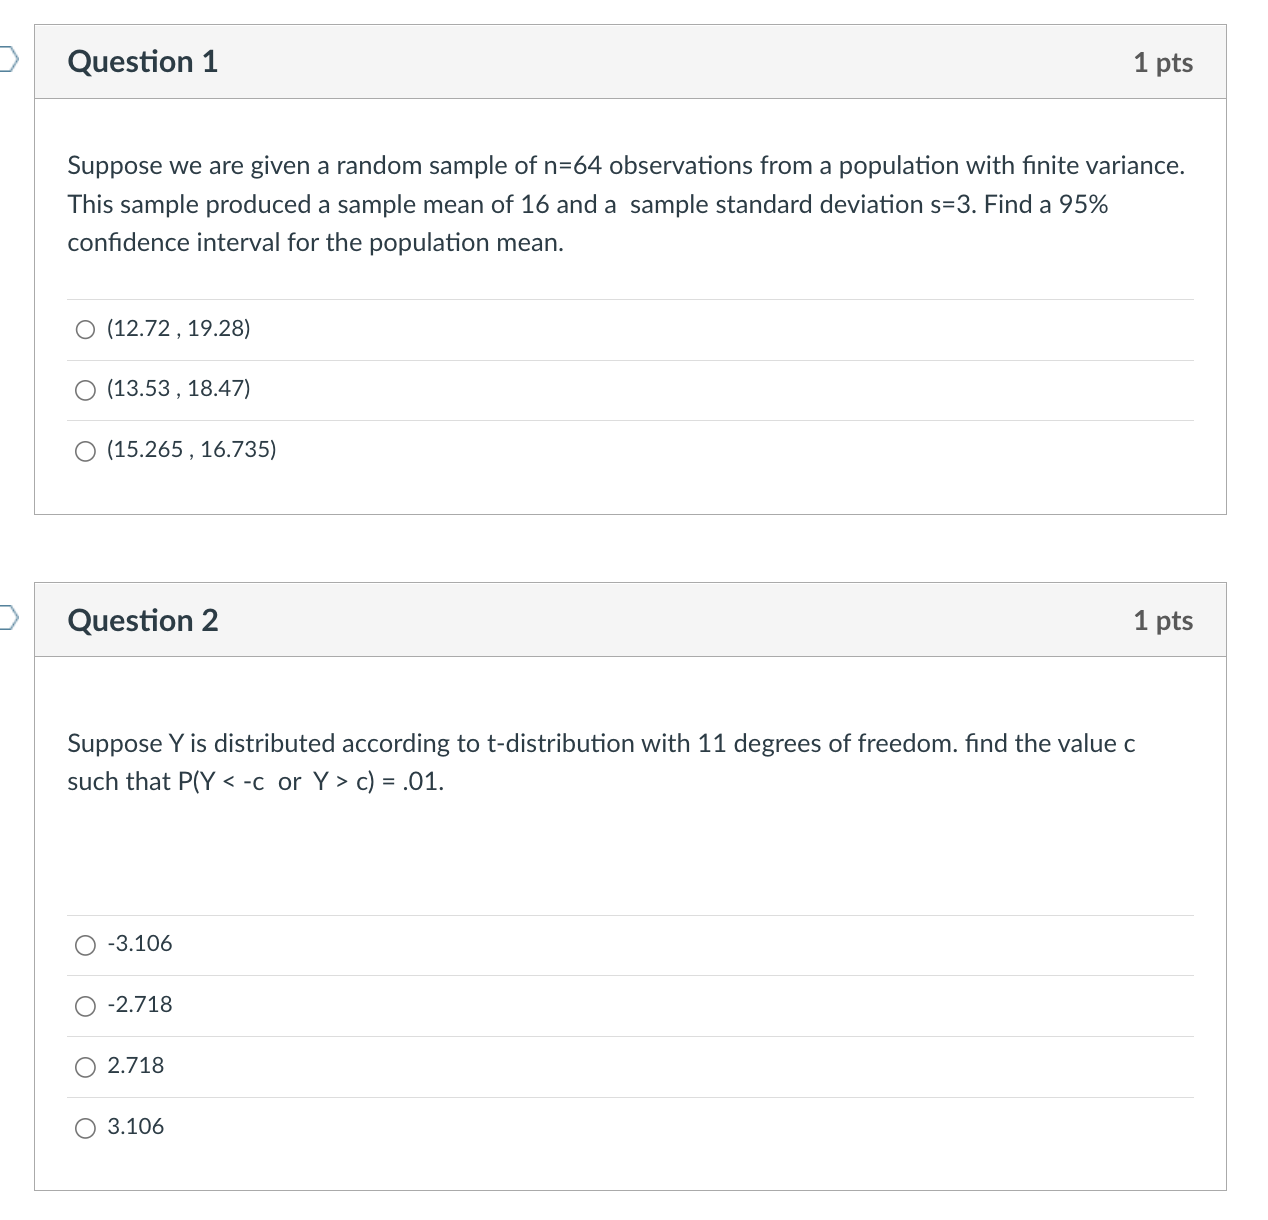
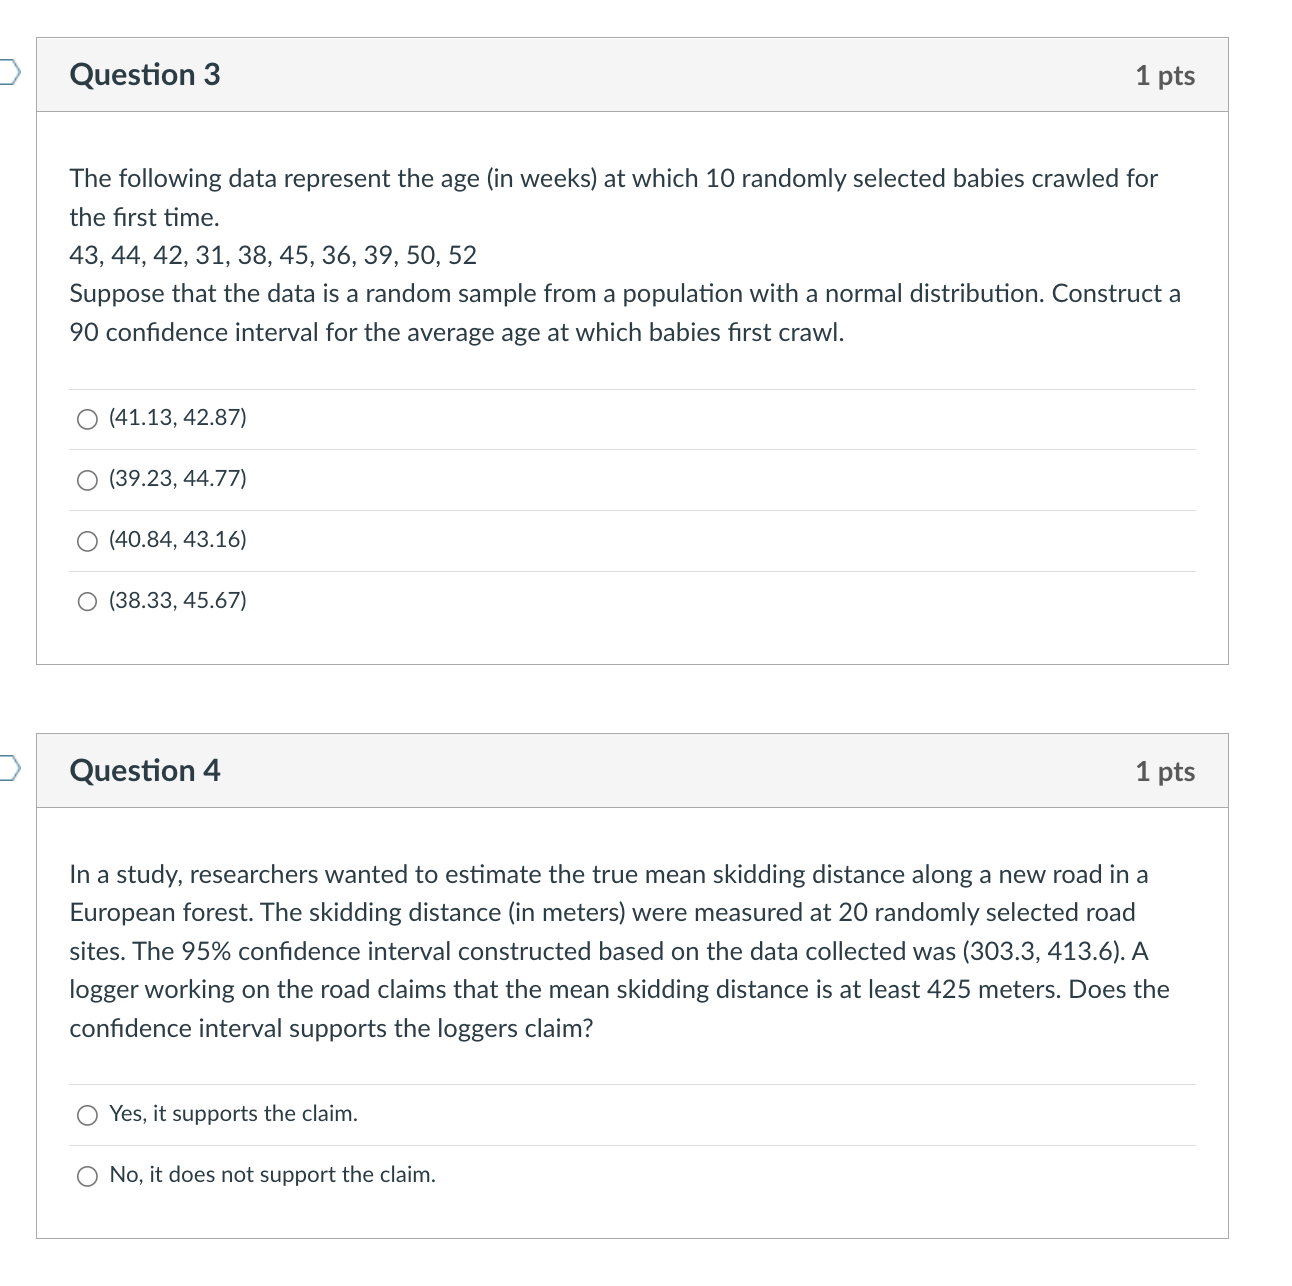
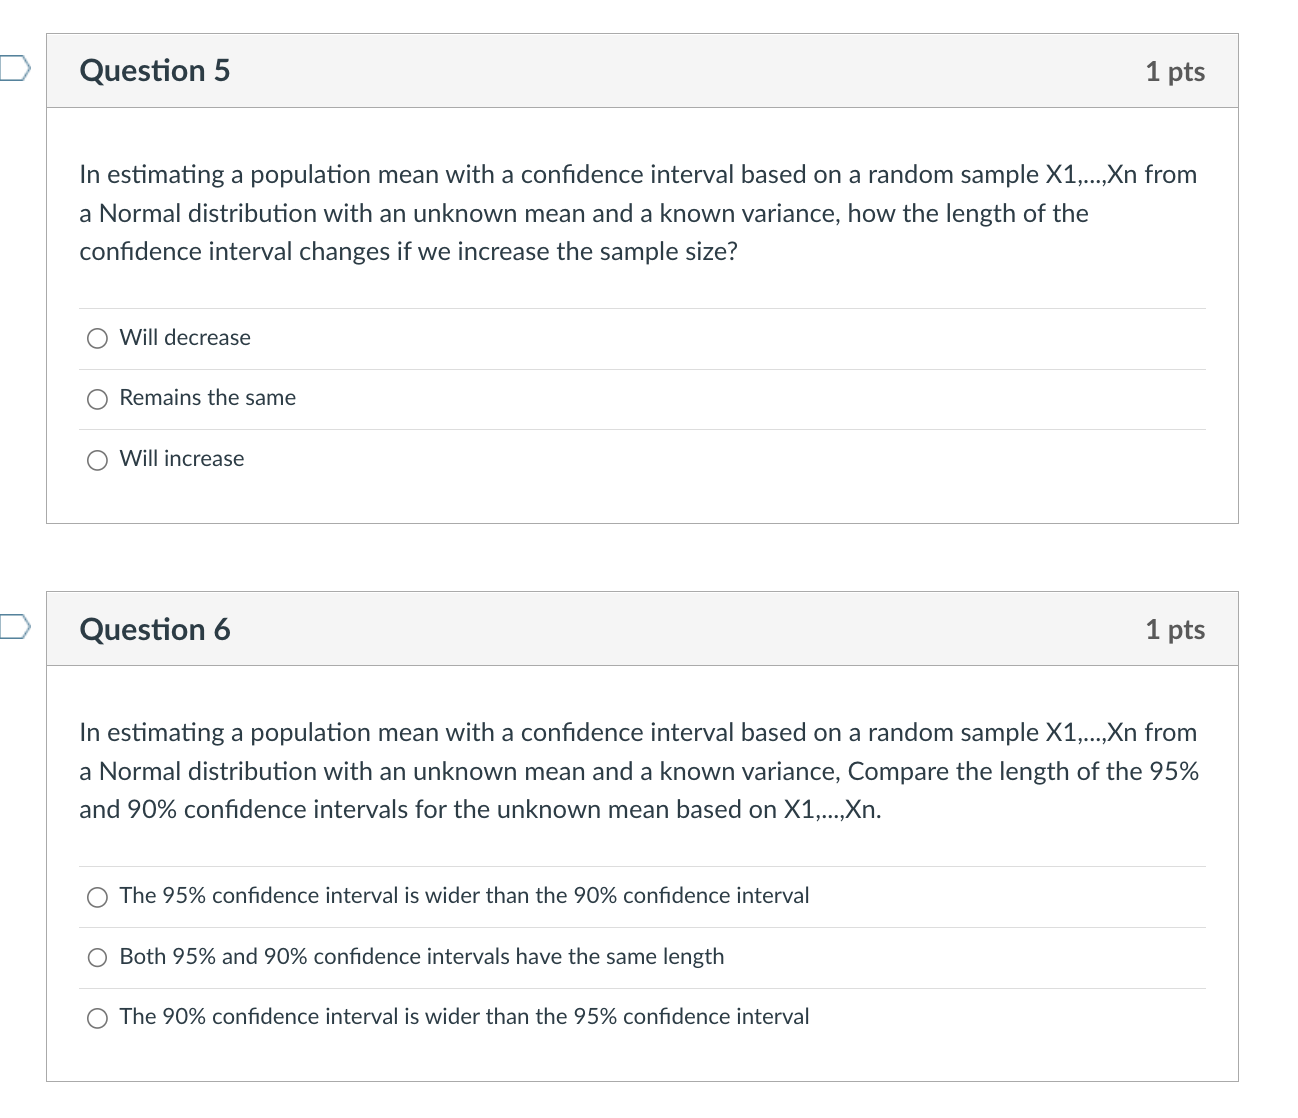
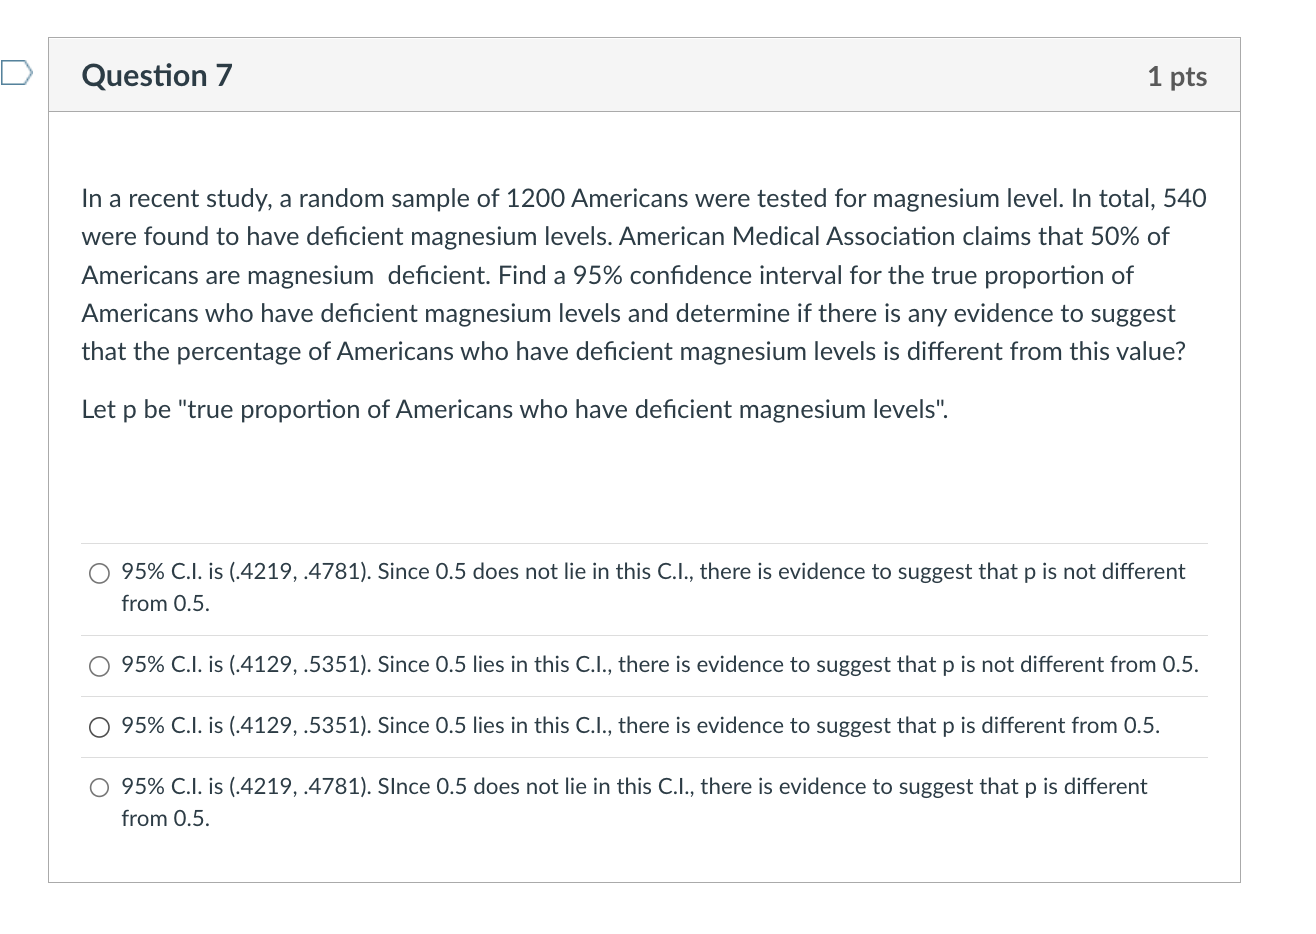
Question 1 1 pts Suppose we are given a random sample of n=64 observations from a population with finite variance. This sample produced a sample mean of 16 and a sample standard deviation s=3. Find a 95% confidence interval for the population mean. O (12.72 , 19.28) O (13.53 , 18.47) O (15.265 , 16.735) Question 2 1 pts Suppose Y is distributed according to t-distribution with 11 degrees of freedom. find the value c such that P(Y c) = .01. O -3.106 O -2.718 O 2.718 O 3.106Question 3 1 pts The following data represent the age (in weeks) at which 10 randomly selected babies crawled for the first time. 43, 44, 42, 31, 38, 45, 36, 39, 50, 52 Suppose that the data is a random sample from a population with a normal distribution. Construct a 90 confidence interval for the average age at which babies first crawl. O (41.13, 42.87) O (39.23, 44.77) O (40.84, 43.16) O (38.33, 45.67) Question 4 1 pts In a study, researchers wanted to estimate the true mean skidding distance along a new road in a European forest. The skidding distance (in meters) were measured at 20 randomly selected road sites. The 95% confidence interval constructed based on the data collected was (303.3, 413.6). A logger working on the road claims that the mean skidding distance is at least 425 meters. Does the confidence interval supports the loggers claim? Yes, it supports the claim. O No, it does not support the claim.D Question 5 1 pts In estimating a population mean with a confidence interval based on a random sample X1,...,Xn from a Normal distribution with an unknown mean and a known variance, how the length of the confidence interval changes if we increase the sample size? O Will decrease Remains the same O Will increase Question 6 1 pts In estimating a population mean with a confidence interval based on a random sample X1,...,Xn from a Normal distribution with an unknown mean and a known variance, Compare the length of the 95% and 90% confidence intervals for the unknown mean based on X1,..., Xn. O The 95% confidence interval is wider than the 90% confidence interval O Both 95% and 90% confidence intervals have the same length O The 90% confidence interval is wider than the 95% confidence intervalQuestion 7 1 pts In a recent study, a random sample of 1200 Americans were tested for magnesium level. In total, 540 were found to have deficient magnesium levels. American Medical Association claims that 50% of Americans are magnesium deficient. Find a 95% confidence interval for the true proportion of Americans who have deficient magnesium levels and determine if there is any evidence to suggest that the percentage of Americans who have deficient magnesium levels is different from this value? Let p be "true proportion of Americans who have deficient magnesium levels". O 95% C.I. is (.4219, .4781). Since 0.5 does not lie in this C.I., there is evidence to suggest that p is not different from 0.5. 95% C.I. is (.4129, .5351). Since 0.5 lies in this C.I., there is evidence to suggest that p is not different from 0.5. O 95% C.I. is (.4129, .5351). Since 0.5 lies in this C.I., there is evidence to suggest that p is different from 0.5. O 95% C.I. is (.4219, .4781). Since 0.5 does not lie in this C.I., there is evidence to suggest that p is different from 0.5
Step by Step Solution
There are 3 Steps involved in it

Get step-by-step solutions from verified subject matter experts