

Question: Question 1 1 pts Test scores on a Statistics final had a mean of 78 with a standard deviation of 16. Luisa earned a score
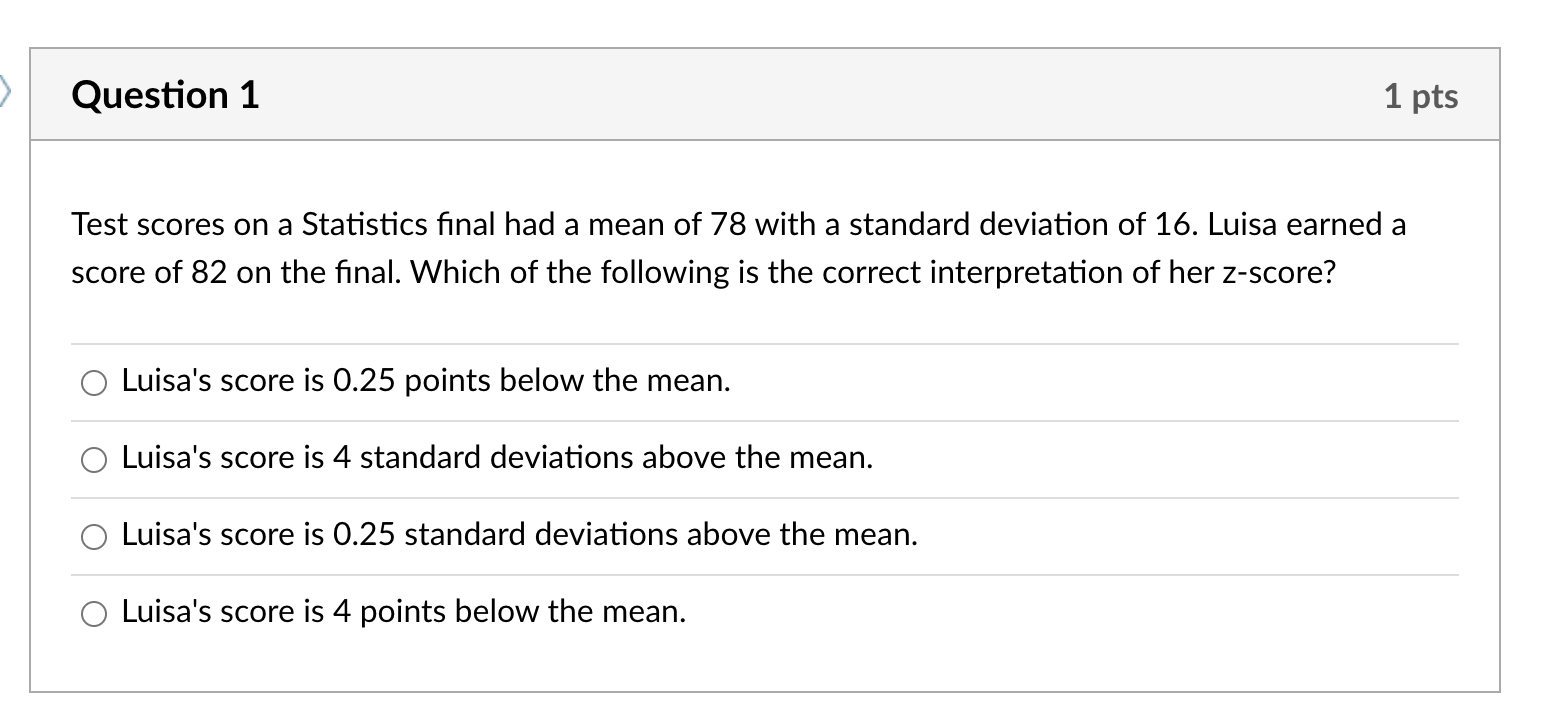

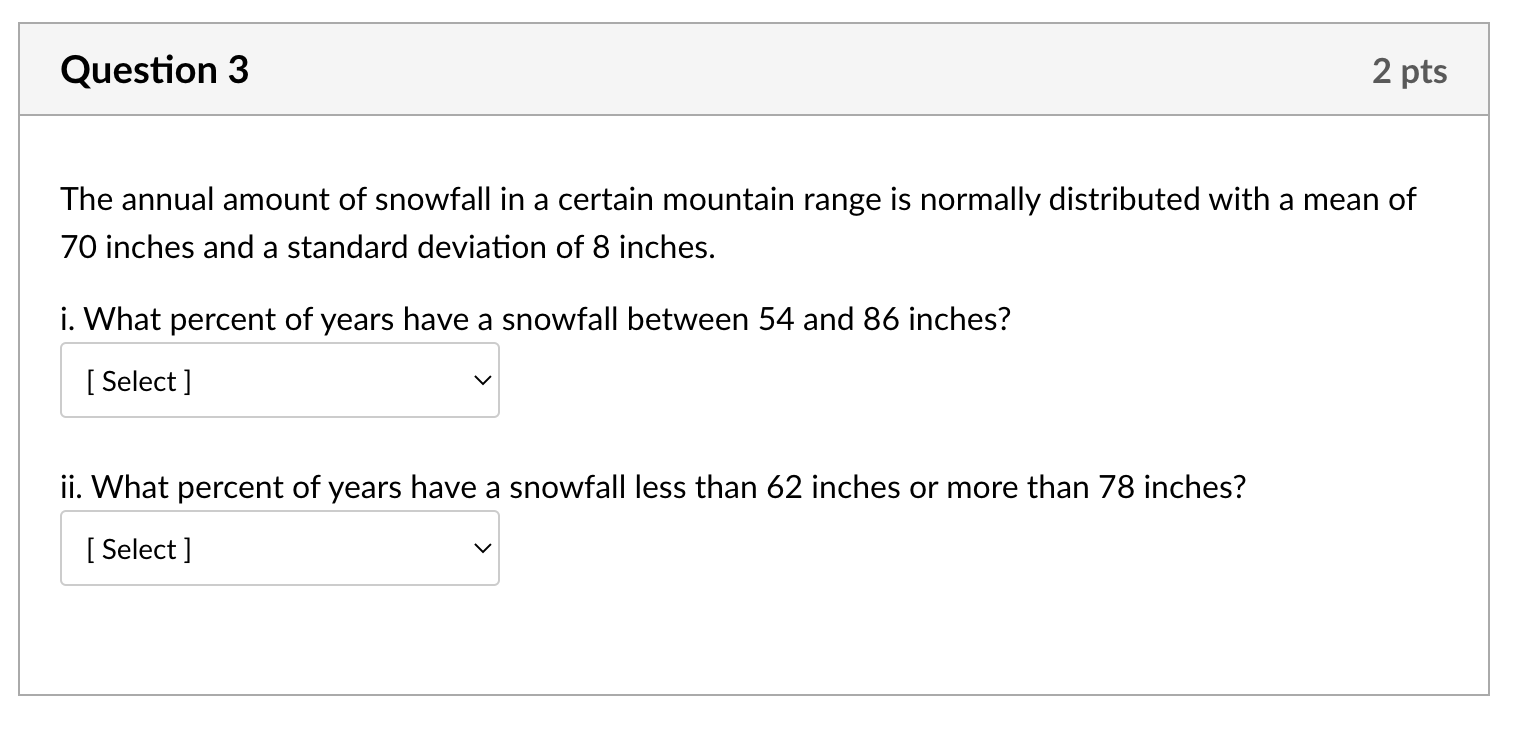
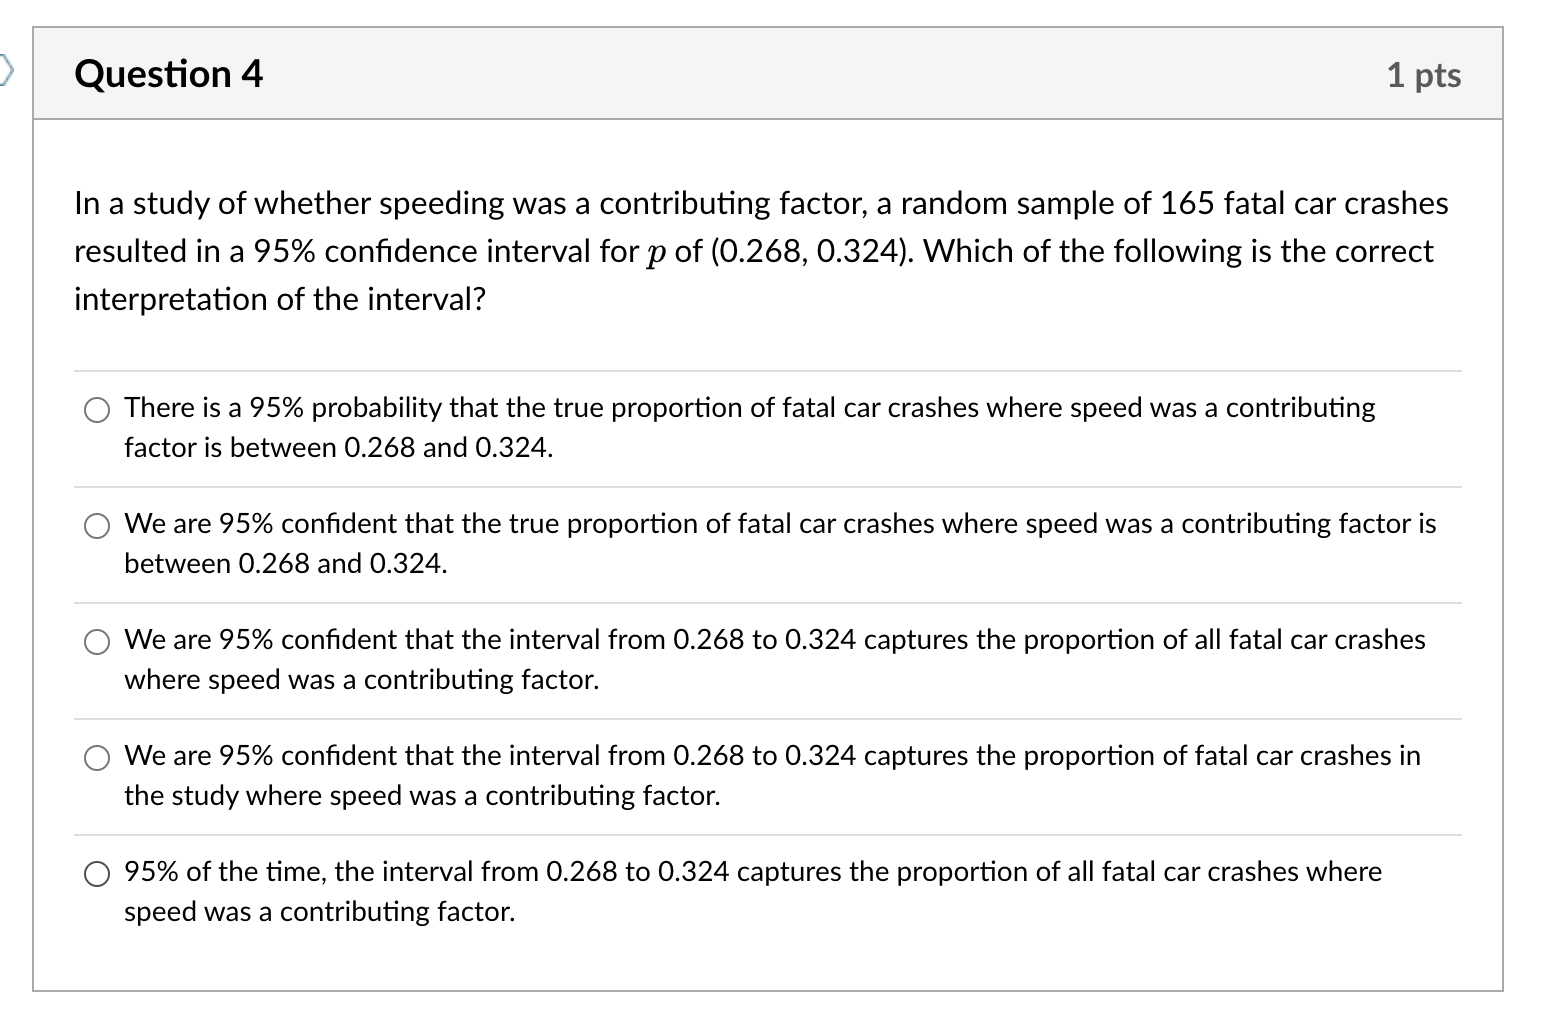
Question 1 1 pts Test scores on a Statistics final had a mean of 78 with a standard deviation of 16. Luisa earned a score of 82 on the final. Which of the following is the correct interpretation of her z-score? O Luisa's score is 0.25 points below the mean. O Luisa's score is 4 standard deviations above the mean. O Luisa's score is 0.25 standard deviations above the mean. O Luisa's score is 4 points below the mean.Question 2 3 pts The weights of the sh in a certain lake are normally distributed with a mean of 20 pounds and a standard deviation of 5 pounds. Round your answers to four decimal places. i. What is the probability that a randomly selected sh weighs less than 18 pounds? ii. What is the probability that a randomly selected sh weights between 14 and 24 pounds? iii. Find the weight such that 15% of sh are heavier than it. Question 3 2 pts The annual amount of snowfall in a certain mountain range is normally distributed with a mean of 70 inches and a standard deviation of 8 inches. i. What percent of years have a snowfall between 54 and 86 inches? [ Select ] V ii. What percent of years have a snowfall less than 62 inches or more than 78 inches? [ Select ] V Question 4 1 pts In a study of whether speeding was a contributing factor, a random sample of 165 fatal car crashes resulted in a 95% condence interval forp of (0.268, 0.324). Which of the following is the correct interpretation of the interval? 0 There is a 95% probability that the true proportion of fatal car crashes where speed was a contributing factor is between 0.268 and 0.324. Q We are 95% condent that the true proportion of fatal car crashes where speed was a contributing factor is between 0.268 and 0.324. Q We are 95% condent that the interval from 0.268 to 0.324 captures the proportion of all fatal car crashes where speed was a contributing factor. Q We are 95% condent that the interval from 0.268 to 0.324 captures the proportion of fatal car crashes in the study where speed was a contributing factor. Q 95% of the time, the interval from 0.268 to 0.324 captures the proportion of all fatal car crashes where speed was a contributing factor
Step by Step Solution
There are 3 Steps involved in it

Get step-by-step solutions from verified subject matter experts