

Question: Question 1 1 : Where possible, using the improved line listing, calculate incubation periods and illustrate their distribution with an appropriate graph ( using Excel
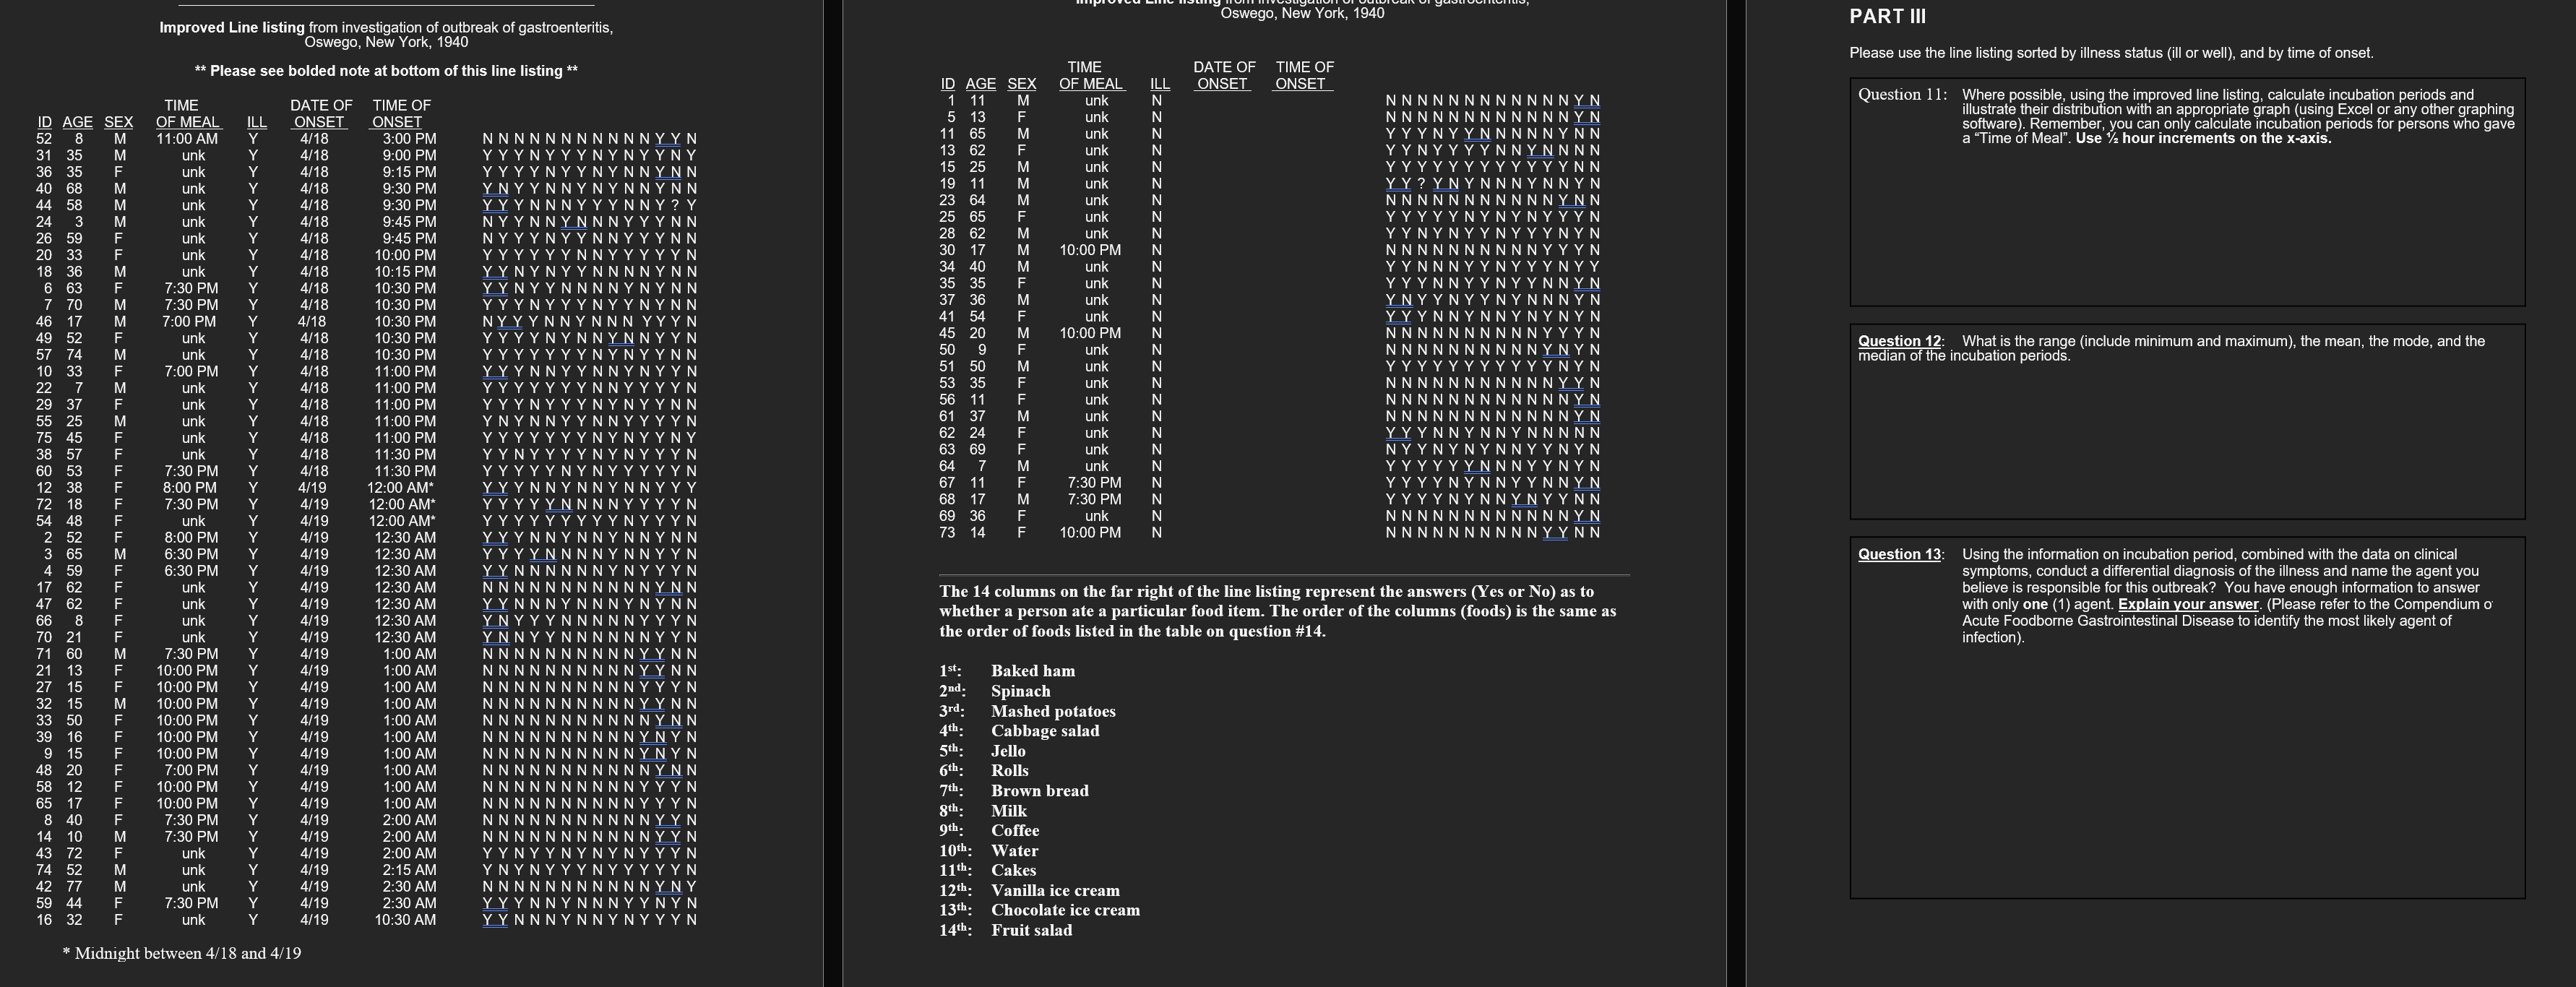
Question : Where possible, using the improved line listing, calculate incubation periods and illustrate their distribution with an appropriate graph using Excel or any other graphing software Remember, you can only calculate incubation periods for persons who gave a Time of Meal Use hour increments on the xaxis.
Question : What is the range include minimum and maximum the mean, the mode, and the median of the incubation periods.
Question :Using the information on incubation period, combined with the data on clinical symptoms, conduct a differential diagnosis of the illness and name the agent you believe is responsible for this outbreak? You have enough information to answer with only one agent. Explain your answer. Please refer to the Compendium of Acute Foodborne Gastrointestinal Disease to identify the most likely agent of infection
Step by Step Solution
There are 3 Steps involved in it
1 Expert Approved Answer
Step: 1 Unlock

Question Has Been Solved by an Expert!
Get step-by-step solutions from verified subject matter experts
Step: 2 Unlock
Step: 3 Unlock