

Question: Question 1 (10 Marks) Use the data in Life.xlsx to answer this question. The le contains data on longevity (life expectancy at birth) for 148
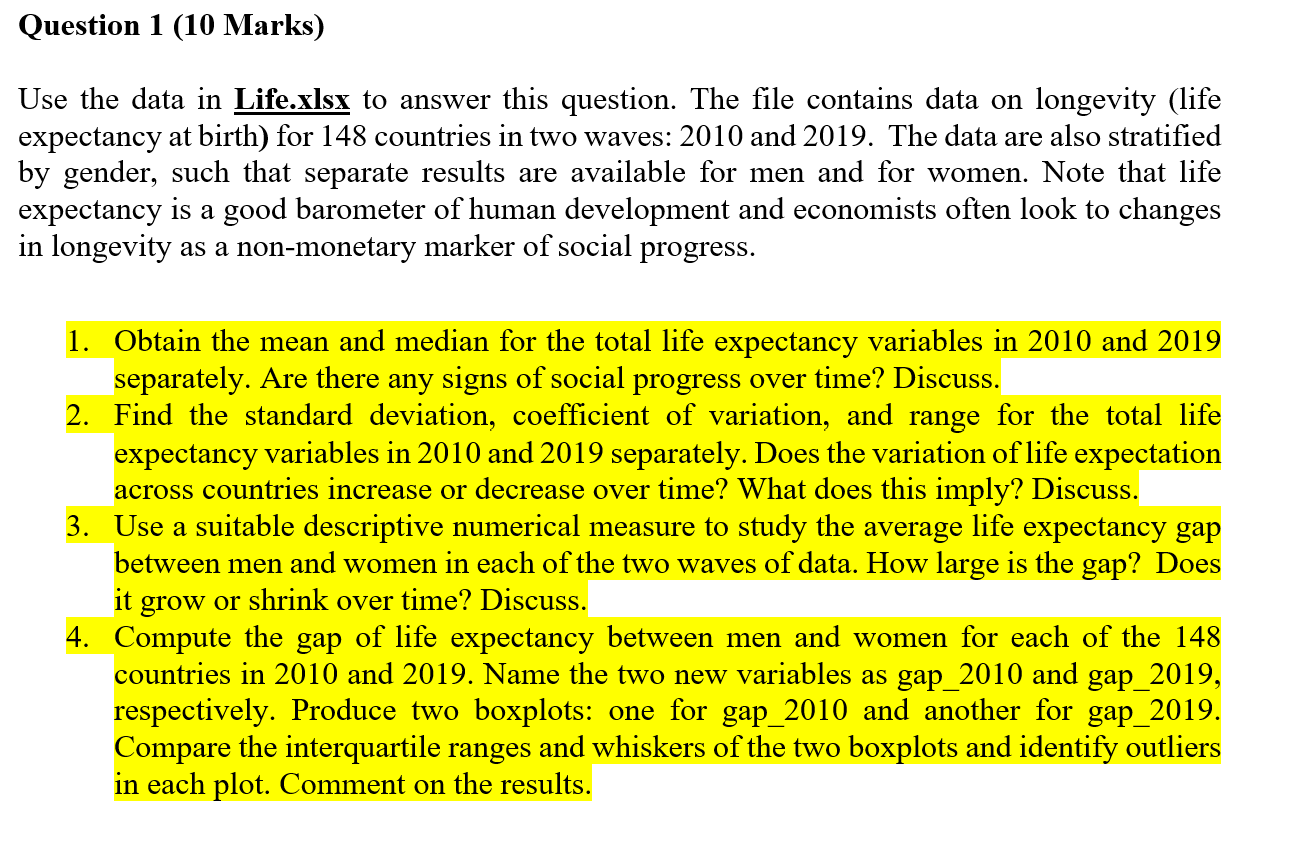
Question 1 (10 Marks) Use the data in Life.xlsx to answer this question. The le contains data on longevity (life expectancy at birth) for 148 countries in two waves: 2010 and 2019. The data are also stratied by gender, such that separate results are available for men and for women. Note that life expectancy is a good barometer of human development and economists often look to changes in longevity as a nonmonetary marker of social progress. 1. Obtain the mean and median for the total life expectancy variables in 2010 and 2019 separately. Are there any signs of social progress over time? Discuss. 2. Find the standard deviation, coefcient of variation, and range for the total life expectancy variables in 2010 and 2019 separately. Does the variation of life expectation across countries increase or decrease over time? What does this imply? Discuss. 3. Use a suitable descriptive numerical measure to study the average life expectancy gap between men and women in each of the two waves of data. How large is the gap? Does it grow or shrink over time? Discuss. 4. Compute the gap of life expectancy between men and women for each of the 148 countries in 2010 and 2019. Name the two new variables as gap_2010 and gap_2019, respectively. Produce two boxplots: one for gap_2010 and another for gap_2019. Compare the interquartile ranges and whiskers of the two boxplots and identify outliers in each plot. Comment on the results
Step by Step Solution
There are 3 Steps involved in it

Get step-by-step solutions from verified subject matter experts