

Question: Question 1 10 points Save Answer Please identify and explain the graph. $25,000 - $20,000 $18,000 A $16,000 $15,000 Income $10,000 $5,000 $0 + 0


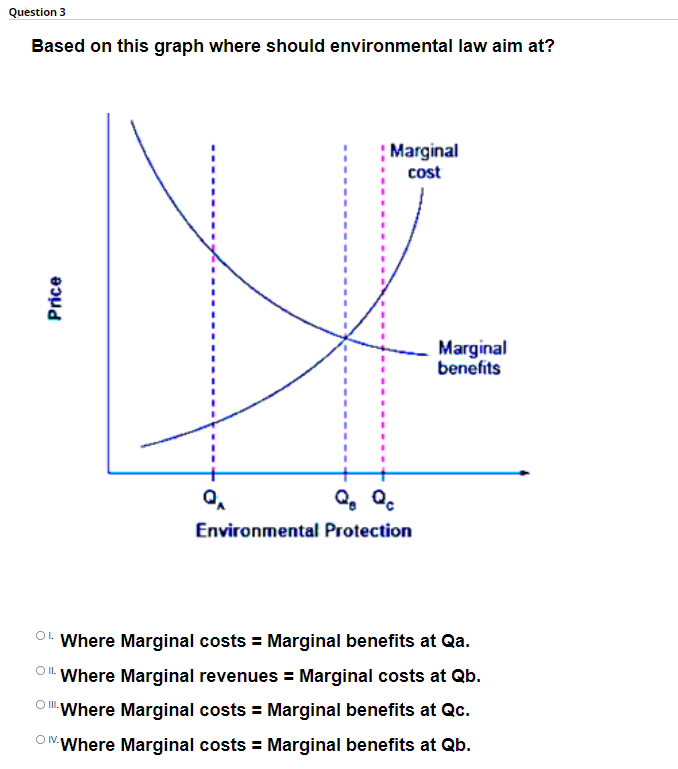
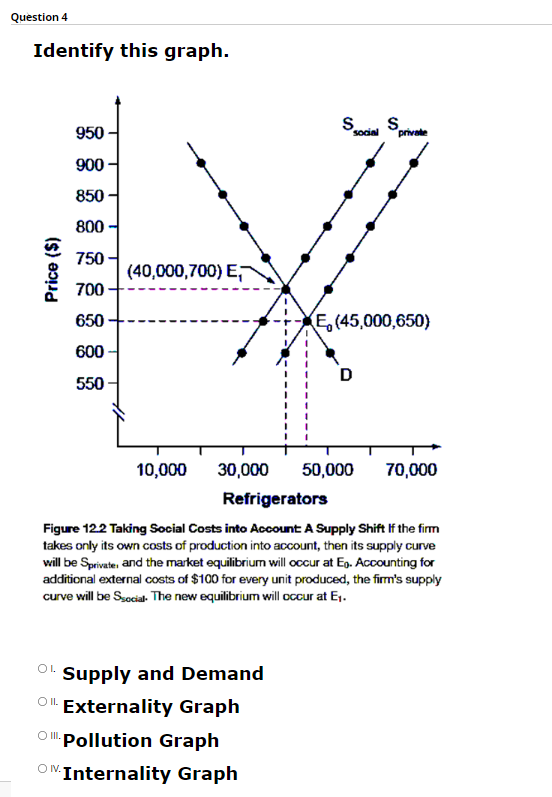


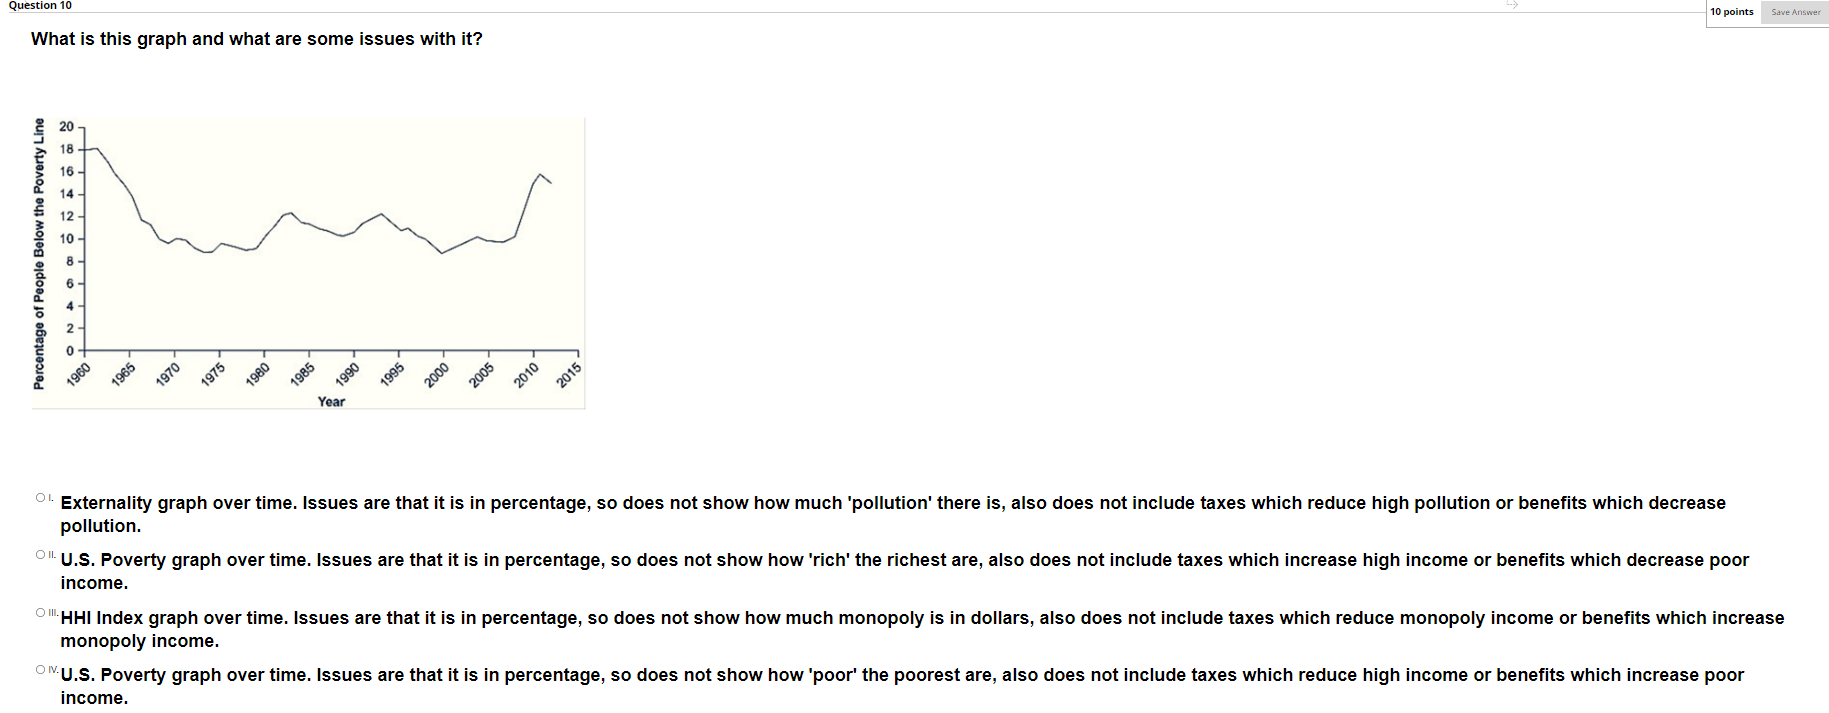
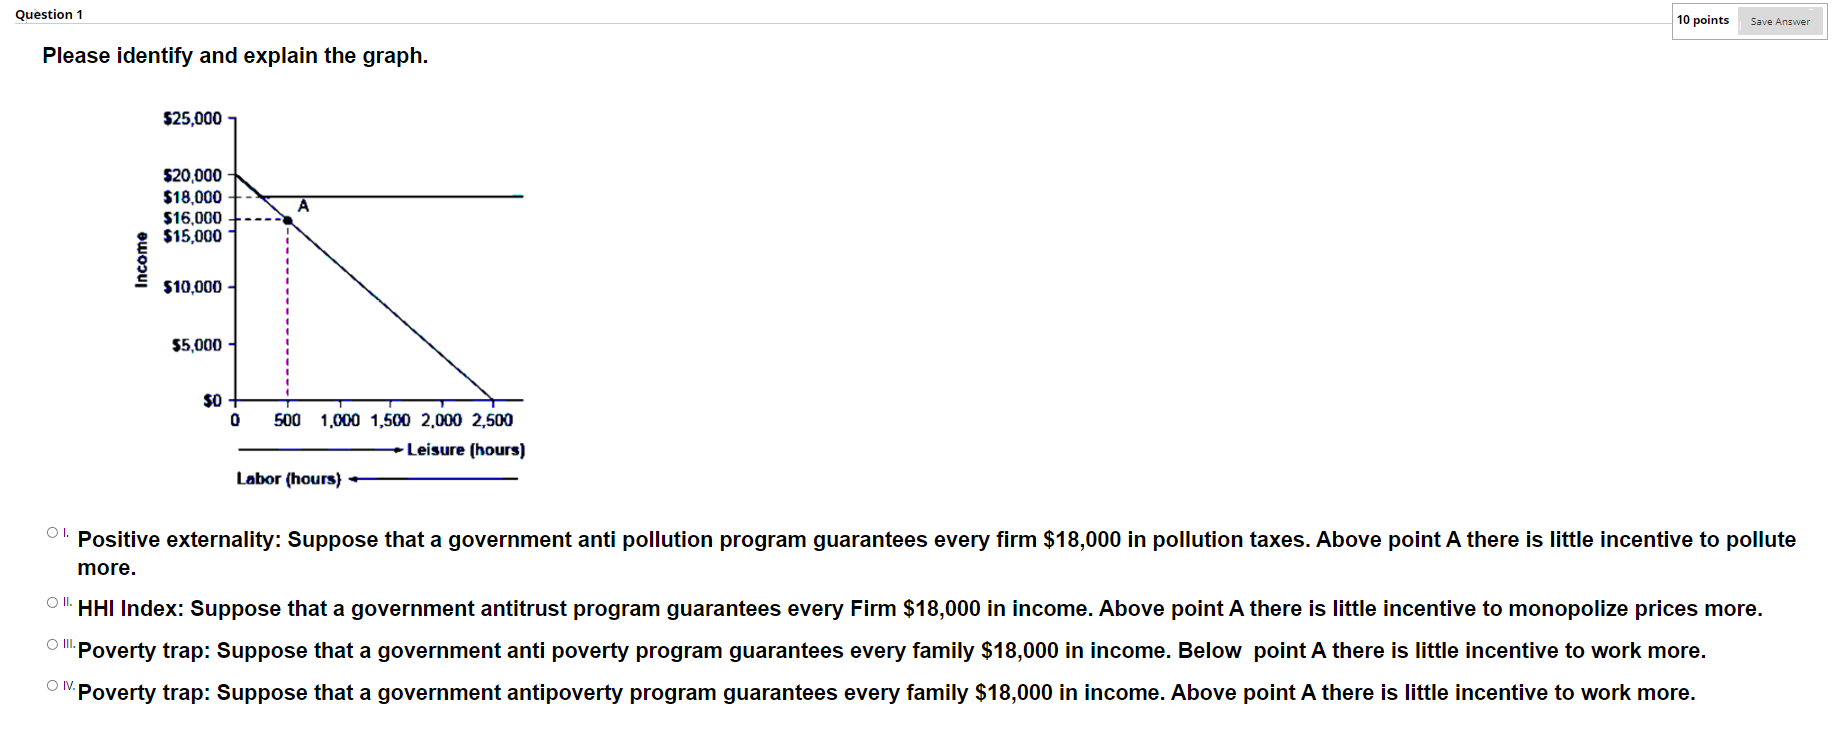
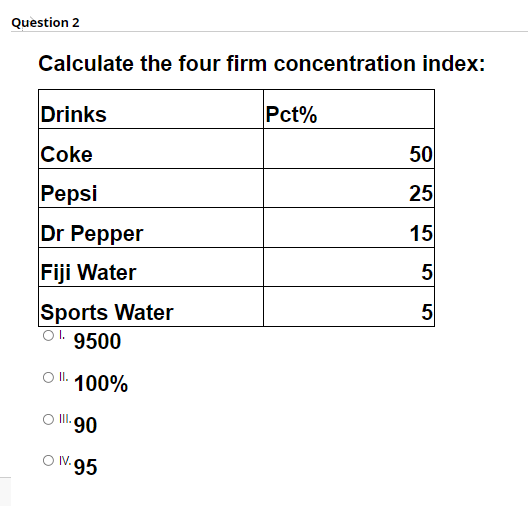


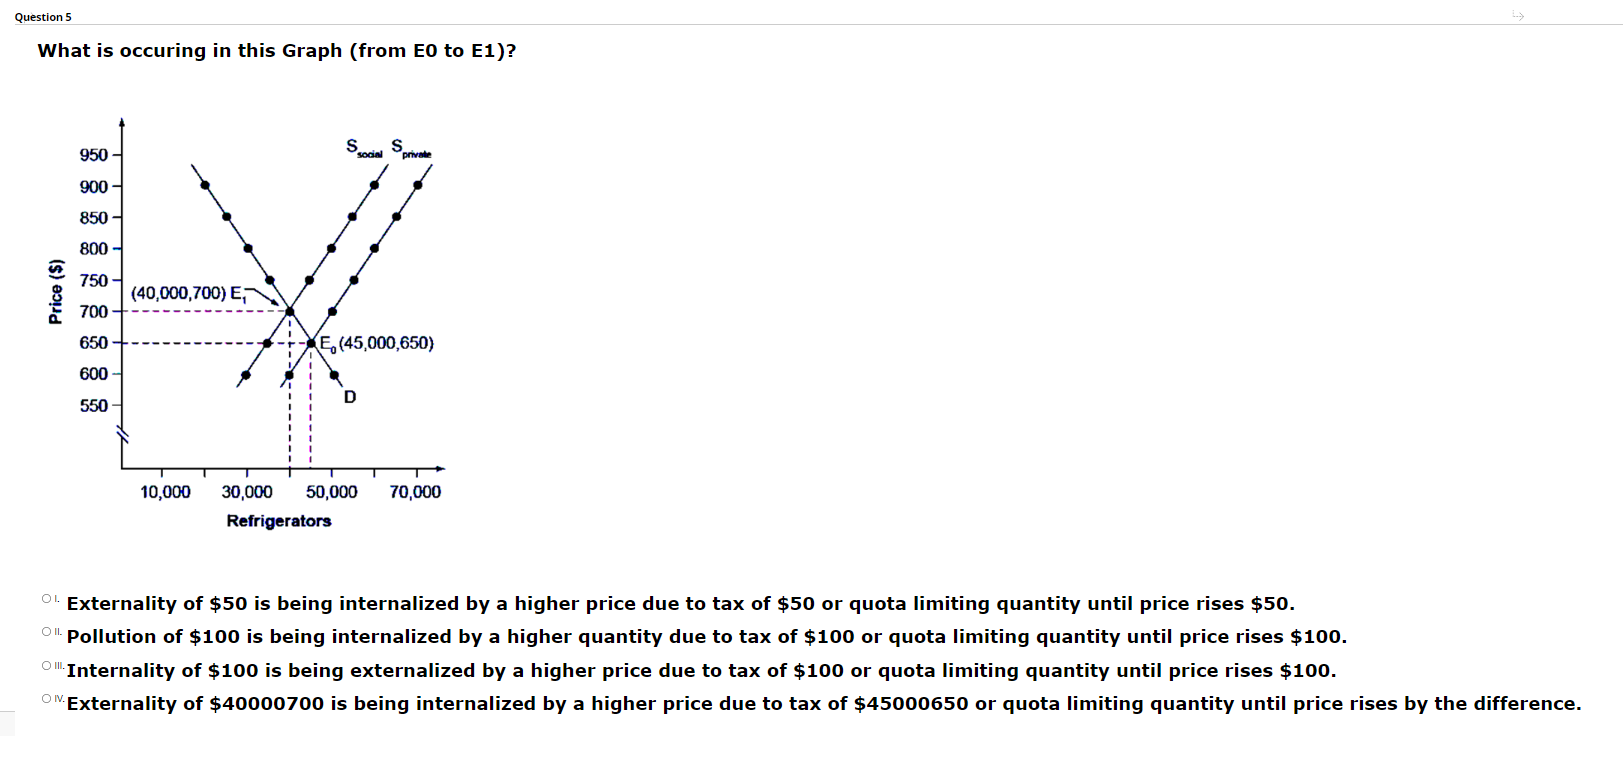
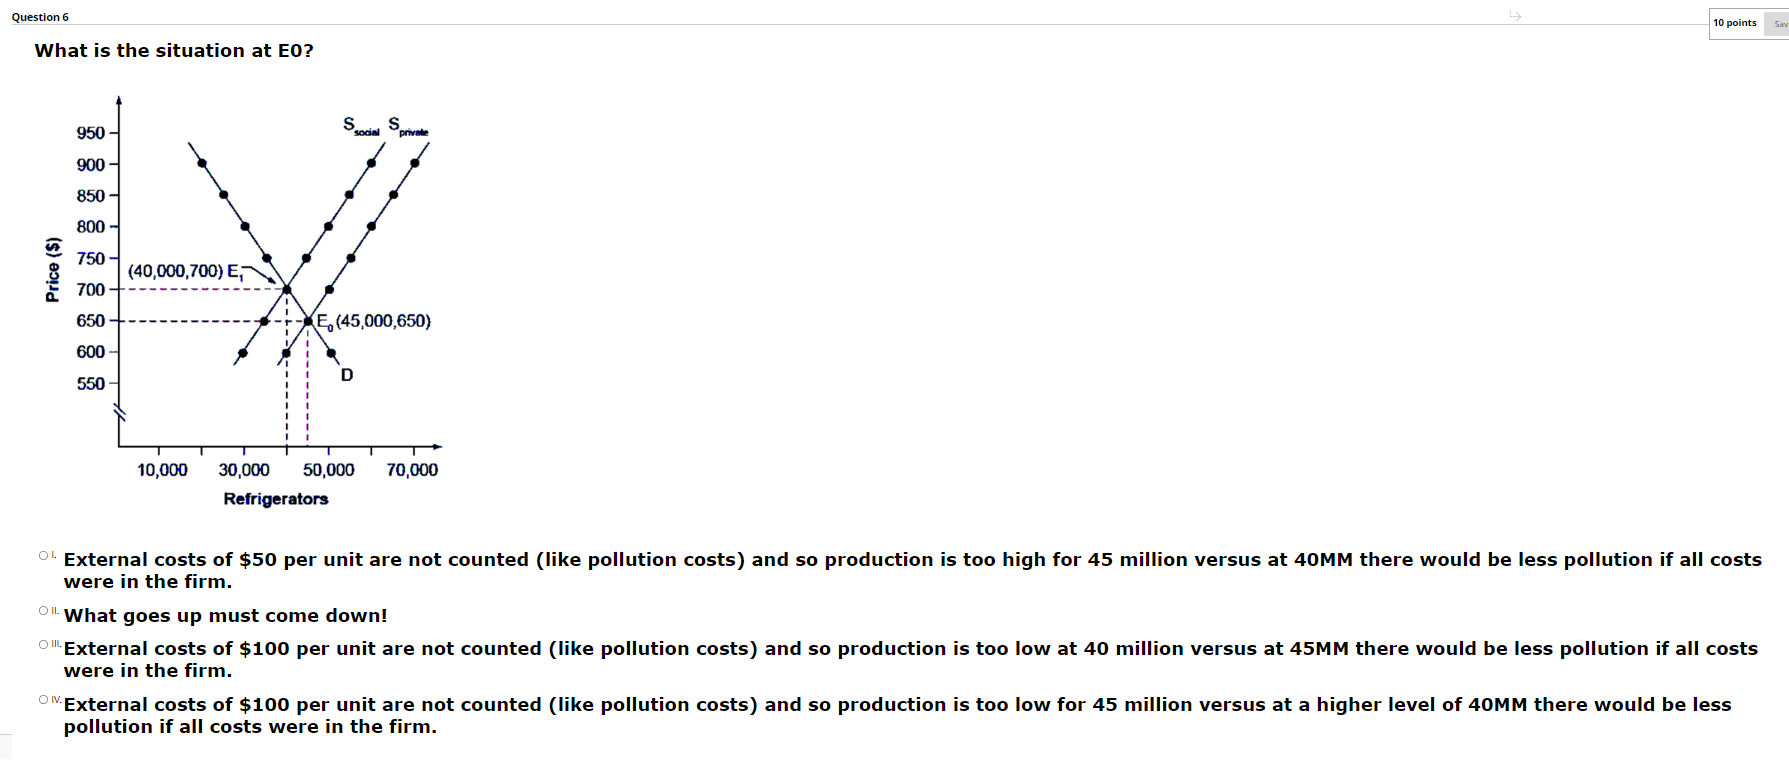
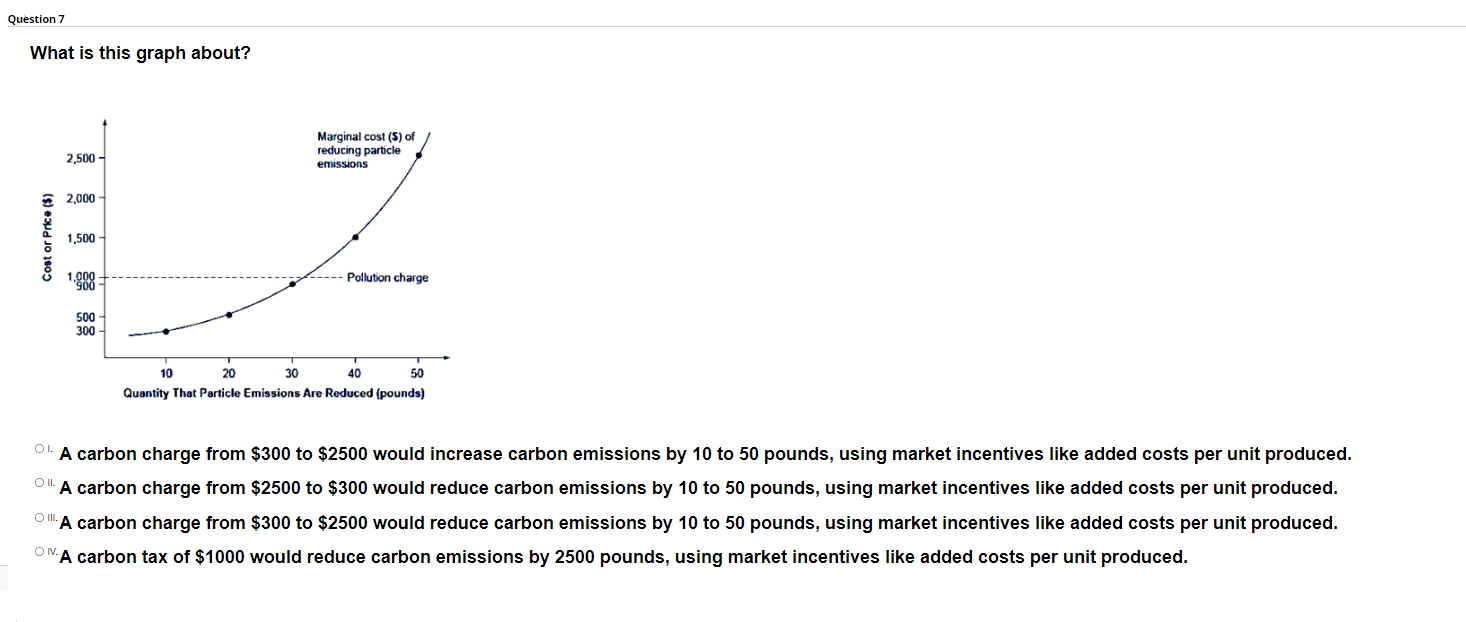
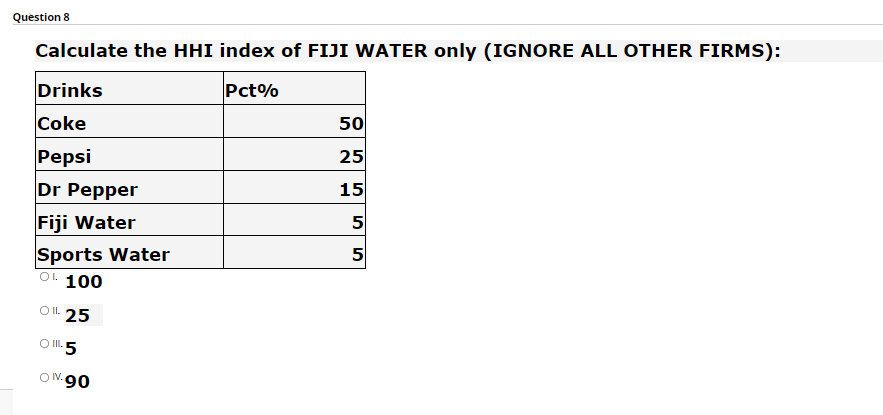
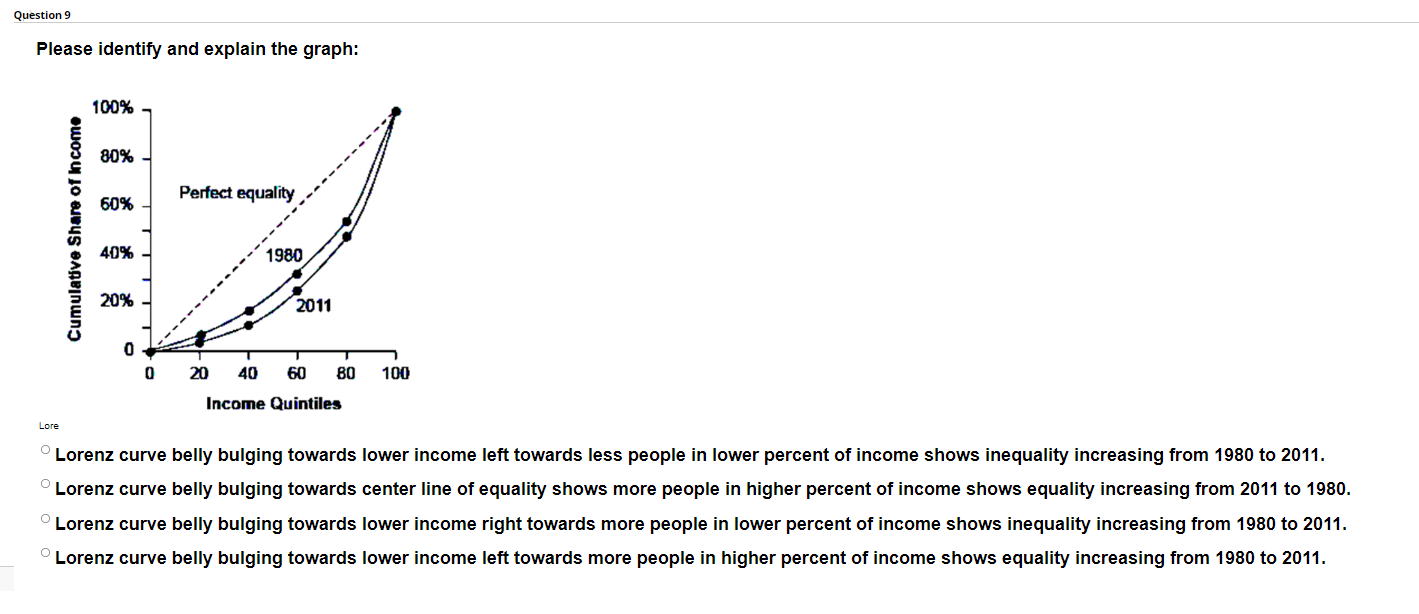

Question 1 10 points Save Answer Please identify and explain the graph. $25,000 - $20,000 $18,000 A $16,000 $15,000 Income $10,000 $5,000 $0 + 0 500 1,000 1,500 2,000 2,500 - Leisure (hours) Labor (hours) + Positive externality: Suppose that a government anti pollution program guarantees every firm $18,000 in pollution taxes. Above point A there is little incentive to pollute more. OHHI Index: Suppose that a government antitrust program guarantees every Firm $18,000 in income. Above point A there is little incentive to monopolize prices more. "Poverty trap: Suppose that a government anti poverty program guarantees every family $18,000 in income. Below point A there is little incentive to work more. ONPoverty trap: Suppose that a government antipoverty program guarantees every family $18,000 in income. Above point A there is little incentive to work more.Question 2 Calculate the four firm concentration index: Drinks Pct% Coke 50 Pepsi 25 Dr Pepper 15 Fiji Water 5 Sports Water 5 0. 9500 Ol. 100% 0 .90 O W.95Question 3 Based on this graph where should environmental law aim at? * Marginal cost . . ...... Price Marginal benefits Q. QC Environmental Protection Ol. Where Marginal costs = Marginal benefits at Qa. Ol. Where Marginal revenues = Marginal costs at Qb. "Where Marginal costs = Marginal benefits at Qc. ON.Where Marginal costs = Marginal benefits at Qb.Question 4 Identify this graph. 950 S sodel S private 900 850 800 - 750 - Price ($) (40,000,700) E, 700 650 E. (45,000,650) 600 D 550 10,000 30,000 50,000 70,000 Refrigerators Figure 12 2 Taking Social Costs into Account A Supply Shift If the firm takes only its own costs of production into account, then its supply curve will be Sprivate, and the market equilibrium will occur at Ex- Accounting for additional external costs of $100 for every unit produced, the firm's supply curve will be Ssocial. The new equilibrium will occur at Ey. Ol. Supply and Demand Ol. Externality Graph . Pollution Graph ONInternality Graphleion! What is occuring in this Graph (from E0 to E1)? (40,000,700) Em Price\") E.l (45,0m,650) _______ __.,__ { 10,1110 30.000 SEND 70,000 E 3 0' Externality of $50 is being internalized by a higher price due to tax of $50 or quota limiting quantity until price rises $50. 0\" Pollution of $100 is being internalized by a higher quantity due to tax of $100 or quota limiting quantity until price rises $100. OI"'Internality of $100 is being externalized by a higher price due to tax of $100 or quota limiting quantity until price rises $100. O""Externality of $40000700 is being internalized by a higher price due to tax of $45000650 or quota limiting quantity until price rises by the difference. omens mm 5.. What is the situation at E0? (40,000,700) Ef\\ Price 3) En(45.000.650) I I F I I I I I I I I I TIIIivIr' 10,000 30.000 50,000 70.000 Runner\"! 0' External costs of $50 per unit are not counted (like pollution costs) and so production is too high for 45 million versus at 4OMM there would be less pollution if all costs were in the rm. 0\" What goes up must come down! OHI'External costs of $100 per unit are not counted (like pollution costs) and so production is too low at 40 million versus at 45MM there would be less pollution if all costs were in the rm. 0'\" External costs of $100 per unit are not counted (like pollution costs) and so production is too low for 45 million versus at a higher level of 40MM there would be less pollution if all costs were in the firm. Question 7 What is this graph about? Marginal cost ($) of 2,500 - reducing particle emissions 2,000 Cost or Price ($) 1,500 - 1,000 - 900 - Pollution charge 500 300 - 10 20 30 40 50 Quantity That Particle Emissions Are Reduced (pounds) ". A carbon charge from $300 to $2500 would increase carbon emissions by 10 to 50 pounds, using market incentives like added costs per unit produced. ". A carbon charge from $2500 to $300 would reduce carbon emissions by 10 to 50 pounds, using market incentives like added costs per unit produced. "A carbon charge from $300 to $2500 would reduce carbon emissions by 10 to 50 pounds, using market incentives like added costs per unit produced. ON.A carbon tax of $1000 would reduce carbon emissions by 2500 pounds, using market incentives like added costs per unit produced.Question 8 Calculate the HHI index of FIJI WATER only (IGNORE ALL OTHER FIRMS): Drinks Pct% Coke 50 Pepsi 25 Dr Pepper 15 Fiji Water 5 Sports Water 5 0!. 100 Ol. 25 0 1. 5 ON. 90Question 9 Please identify and explain the graph: 100% 80% 605 4405 20% Cumulative Snail or heat. 0 204051801\") IncomoQuhths Lure O Lorenz curve belly bulging towards lower income left towards less people in lower percent of income shows inequality increasing from 1980 to 2011. O Lorenz curve belly bulging towards center line of equality shows more people in higher percent of income shows equality increasing from 2011 to 1980. O Lorenz curve belly bulging towards lower income right towards more people in lower percent of income shows inequality increasing from 1930 to 2011. O Lorenz curve belly bulging towards lower income left towards more people in higher percent of income shows equality increasing from 1990 to 2011. Question 10 10 points Save Answer What is this graph and what are some issues with it? 20 Percentage of People Below the Poverty Line 1965 1970 1975 1980 1985 1990 1995 2000 005 2010 2015 Year " Externality graph over time. Issues are that it is in percentage, so does not show how much 'pollution' there is, also does not include taxes which reduce high pollution or benefits which decrease pollution. ". U.S. Poverty graph over time. Issues are that it is in percentage, so does not show how 'rich' the richest are, also does not include taxes which increase high income or benefits which decrease poor income. ".HHI Index graph over time. Issues are that it is in percentage, so does not show how much monopoly is in dollars, also does not include taxes which reduce monopoly income or benefits which increase monopoly income. ON.U.S. Poverty graph over time. Issues are that it is in percentage, so does not show how 'poor' the poorest are, also does not include taxes which reduce high income or benefits which increase poor income
Step by Step Solution
There are 3 Steps involved in it

Get step-by-step solutions from verified subject matter experts