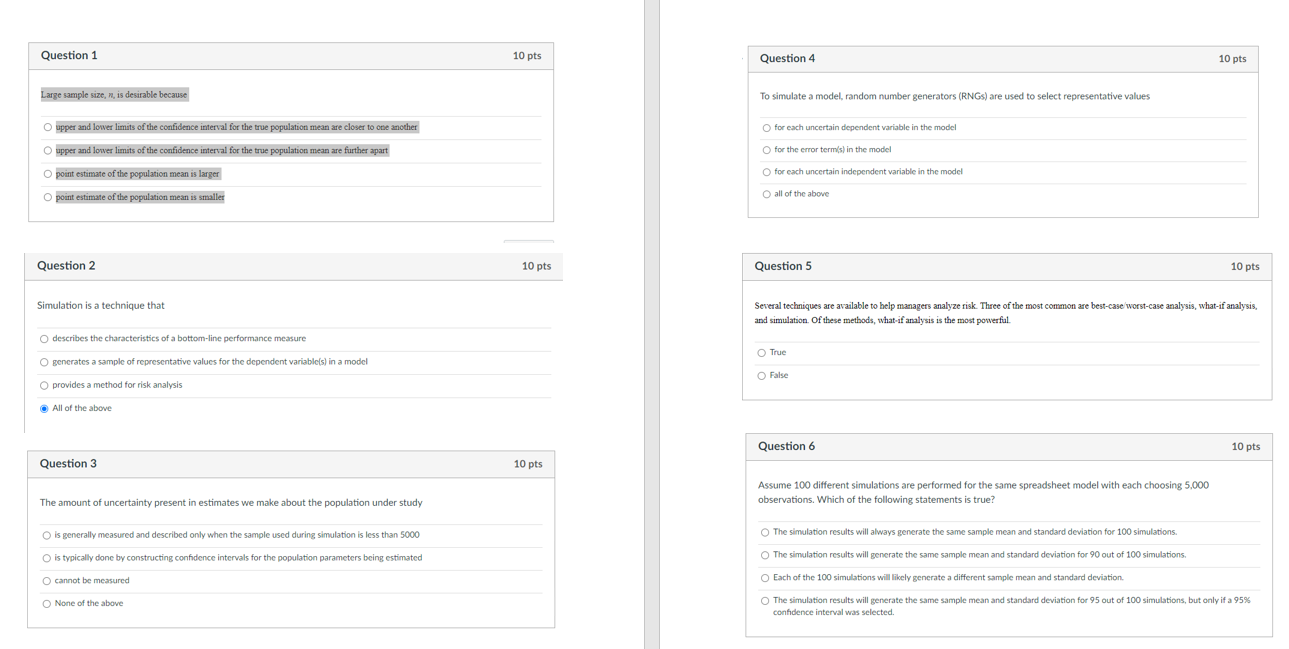
Question: Question 1 10 pts Question 4 10 pts Large sample size, n, is desirable because To simulate a model, random number generators (RNGs) are used

Question 1 10 pts Question 4 10 pts Large sampleQuestion 1 10 pts Question 4 10 pts Large sample

Question 1 10 pts Question 4 10 pts Large sample size, n, is desirable because To simulate a model, random number generators (RNGs) are used to select representative values O for each uncertain dependent variable in the model O upper and lower limits of the confidence interval for the true population mean are closer to one another O upper and lower limits of the confidence interval for the true population mean are further apart for the error term(s) in the model Opoint estimate of the population mean is larger O for each uncertain independent variable in the model point estimate of the population mean is smaller O all of the above Question 2 10 pts Question 5 10 pts Simulation is a technique that Several techniques are available to help managers analyze risk. Three of the most common are best-case worst-case analysis, what-if analysis, and simulation of these methods, what-if analysis is the most powerful. True describes the characteristics of a bottom-line performance measure a O generates a sample of representative values for the dependent variable(s) in a model O provides a method for risk analysis a O False All of the above Question 6 10 pts Question 3 10 pts Assume 100 different simulations are performed for the same spreadsheet model with each choosing 5,000 observations. Which of the following statements is true? The amount of uncertainty present in estimates we make about the population under study O is generally measured and described only when the sample used during simulation is less than 5000 The simulation results will always generate the same sample mean and standard deviation for 100 simulations. is typically done by constructing confidence intervals for the population parameters being estimated The simulation results will generate the same sample mean and standard deviation for 90 out of 100 simulations. cannot be measured Each of the 100 simulations will likely generate a different sample mean and standard deviation None of the above The simulation results will generate the same sample mean and standard deviation for 95 out of 100 simulations, but only if a 95% confidence interval was selected Question 7 10 pts Question 10 10 pts If there is uncertainty present in the input cells of a spreadsheet model The benefit(s) of simulation discussed in the text include(s) the model is invalid 0 Othere is uncertainty in the value of the output cells) O gaining better insight into a problem O providing information on both the variability and distribution of sample values for an outcome measure O providing hard evidence (1.e., facts and figures) that can be used in objectively making decisions O it is impossible to construct a confidence interval for the model All of the above all of the above Question 8 10 pts The sample mean and standard deviation obtained during simulation are likely equal to the mean and standard deviation of the population are estimates of the true characteristics of the population should be the same regardless of the sample size selected for simulation should not be used to make inferences about a population Question 9 10 pts The Project Selection example in Chapter 12 includes modeling the revenue associated with successful projects, using the minimum, maximum, and most likely values for each project's revenue. This is an example of the distribution. O triangular O normal uniform binomial

Step by Step Solution

There are 3 Steps involved in it

1 Expert Approved Answer
Step: 1 Unlock blur-text-image
Question Has Been Solved by an Expert!

Get step-by-step solutions from verified subject matter experts

Step: 2 Unlock
Step: 3 Unlock

Students Have Also Explored These Related General Management Questions!