

Question: Question 1 (15 marks) Consider the following summary statistics, correlation table and regression output. The variable read_scr is the average reading test score for students


Question 1


![Interval] avginc A B D 0. 000 E 2. 133504 _cons C](https://s3.amazonaws.com/si.experts.images/answers/2024/06/6678116ca404b_8126678116c93a78.jpg)


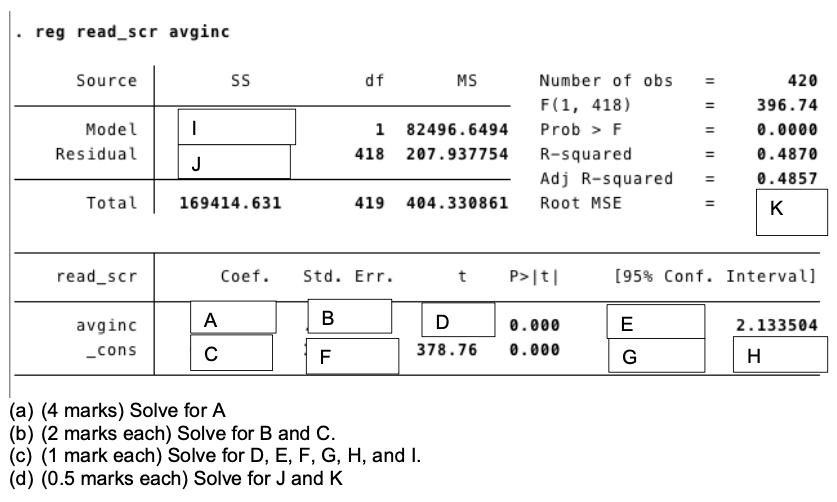
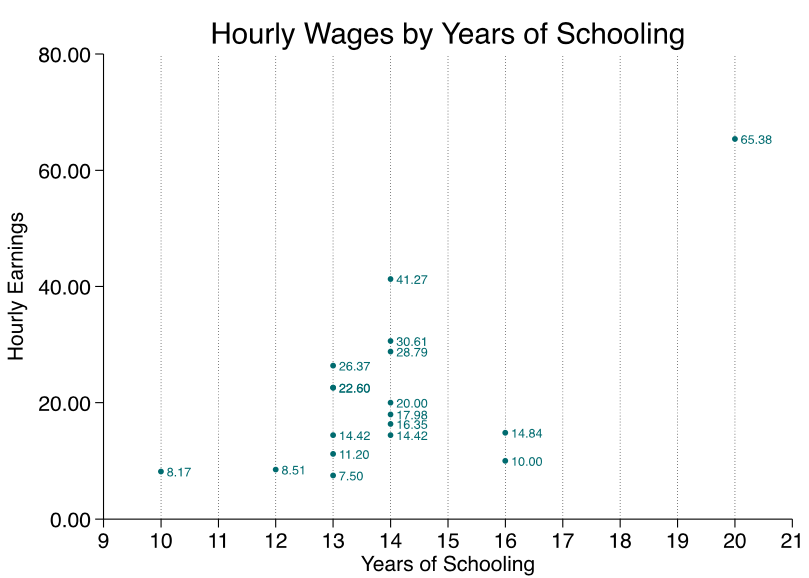
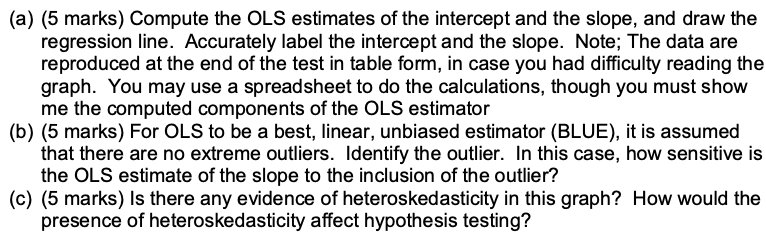
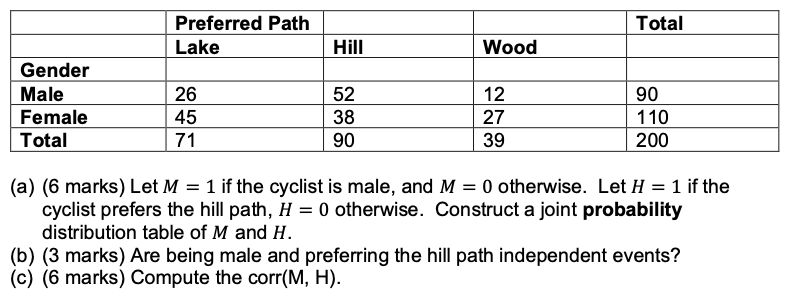
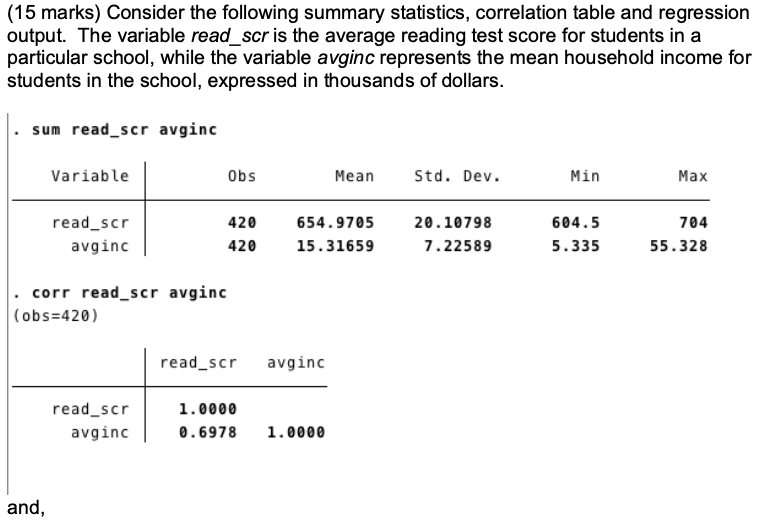
(15 marks) Consider the following summary statistics, correlation table and regression output. The variable read_scr is the average reading test score for students in a particular school, while the variable avginc represents the mean household income for students in the school, expressed in thousands of dollars. sum read_scr avginc Variable Obs Mean Std. Dev. Min Max read_scr 420 654. 9705 20. 10798 604.5 704 avginc 420 15. 31659 7.22589 5.335 55.328 corr read_scr avginc (obs=420) read_scr avginc read_scr 1. 0000 avginc 0. 6978 1. 0000 and,. reg read_scr avginc Source SS df MS Number of obs 420 F(1, 418) = 396. 74 Model - 1 82496.6494 Prob > F 0 . 0000 Residual J 418 207.937754 R-squared = 0 . 4870 Adj R-squared 0. 4857 Total 169414.631 419 404.330861 Root MSE = K read_scr Coef. Std. Err. t P>It| [95% Conf. Interval] avginc A B D 0. 000 E 2. 133504 _cons C F 378. 76 0.000 G H (a) (4 marks) Solve for A (b) (2 marks each) Solve for B and C. (c) (1 mark each) Solve for D, E, F, G, H, and I. (d) (0.5 marks each) Solve for J and KConsider the following graph of earnings on years of education. I give the y-coordinates on the graph. The x-coordinates are indicated by the corresponding values on the x- axis.Hourly Wages by Years of Schooling 80.00 . 65.38 60.00 Hourly Earnings 40.00 . 41.27 . 30.61 28.79 26.37 .22.60 20.00 * 20.00 * 17.98 16.35 . 14.42 .14.42 . 14.84 11.20 .10.00 8.17 $ 8.51 $7.50 . . . . . .. ...... . . . ...... . . . . . 0.00 9 10 11 12 13 14 15 16 17 18 19 20 21 Years of Schooling(a) (5 marks) Compute the OLS estimates of the intercept and the slope, and draw the regression line. Accurately label the intercept and the slope. Note; The data are reproduced at the end of the test in table form, in case you had difficulty reading the graph. You may use a spreadsheet to do the calculations, though you must show me the computed components of the OLS estimator (b) (5 marks) For OLS to be a best, linear, unbiased estimator (BLUE), it is assumed that there are no extreme outliers. Identify the outlier. In this case, how sensitive is the OLS estimate of the slope to the inclusion of the outlier? (c) (5 marks) Is there any evidence of heteroskedasticity in this graph? How would the presence of heteroskedasticity affect hypothesis testing?The data are also reproduced here: Hourly Years of Wage Education 26.37 13 41.27 14 22.60 13 14.84 16 11.20 13 7.50 13 30.61 14 14.42 13 16.35 14 17.98 14 65.38 20 20.00 14 8.17 10 14.42 14 8.51 12 28.79 14 22.60 13 10.00 16Consider the following table which shows the joint distribution of gender and preferred paths, in a random sample of 200 cyclists. Preferred Path Total Lake Hill Wood Gender Male 26 52 12 90 Female 45 38 27 110 Total 71 90 39 200 (a) (6 marks) Let M = 1 if the cyclist is male, and M = 0 otherwise. Let H = 1 if the cyclist prefers the hill path, H = 0 otherwise. Construct a joint probability distribution table of M and H. (b) (3 marks) Are being male and preferring the hill path independent events? (c) (6 marks) Compute the corr(M, H)
Step by Step Solution
There are 3 Steps involved in it

Get step-by-step solutions from verified subject matter experts