

Question: Question 1 1ibrary (tidyquant) library (dpiyr) mydata =19900101, mydata. %>% group by (symbol) %>% tq_transmute (aelect = adjusted, mutate_. fun = to. monthly, indexft =
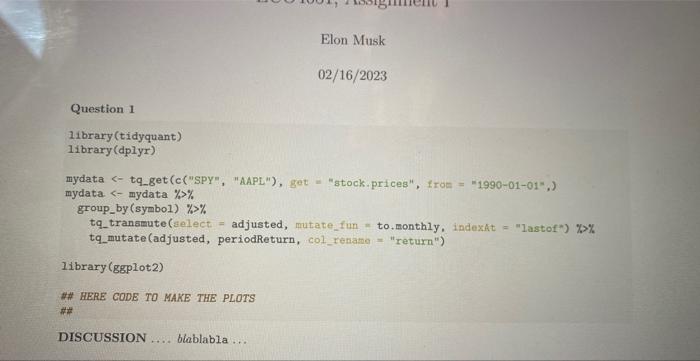
Question 1 1ibrary (tidyquant) library (dpiyr) mydata ="19900101", mydata. %>% group by (symbol) %>% tq_transmute (aelect = adjusted, mutate_. fun = to. monthly, indexft = "lastof") >>% tq_mutate (adjusted, periodReturn, col_tenato = "return") 11brary (ggplot2) A\# HERE CODE TO MAKE THE PLOTS H\# DISCUSSION .... blablabla
Step by Step Solution
There are 3 Steps involved in it
1 Expert Approved Answer
Step: 1 Unlock

Question Has Been Solved by an Expert!
Get step-by-step solutions from verified subject matter experts
Step: 2 Unlock
Step: 3 Unlock