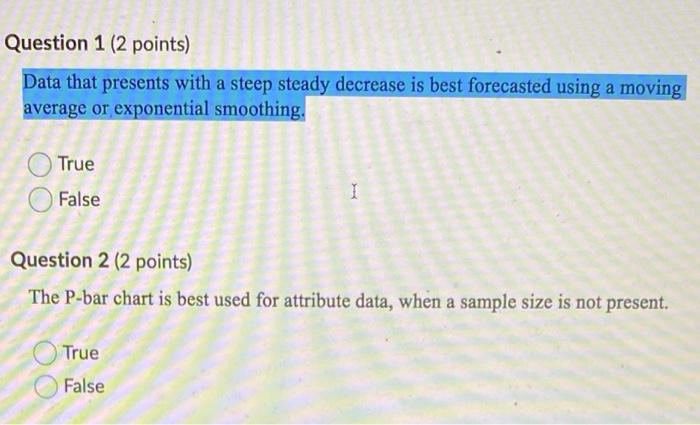
Question: Question 1 (2 points) Data that presents with a steep steady decrease is best forecasted using a moving average or exponential smoothing, True False 1

Question 1 (2 points) Data that presents with a
Question 1 (2 points) Data that presents with a steep steady decrease is best forecasted using a moving average or exponential smoothing, True False 1 Question 2 (2 points) The P-bar chart is best used for attribute data, when a sample size is not present. True False

Step by Step Solution

There are 3 Steps involved in it

1 Expert Approved Answer
Step: 1 Unlock blur-text-image
Question Has Been Solved by an Expert!

Get step-by-step solutions from verified subject matter experts

Step: 2 Unlock
Step: 3 Unlock

Students Have Also Explored These Related General Management Questions!