

Question: Question 1 ( 2 points each ) : Choose the correct answer of the following: Which of the following scatter plots represent a negative liner
Question points each : Choose the correct answer of the following:
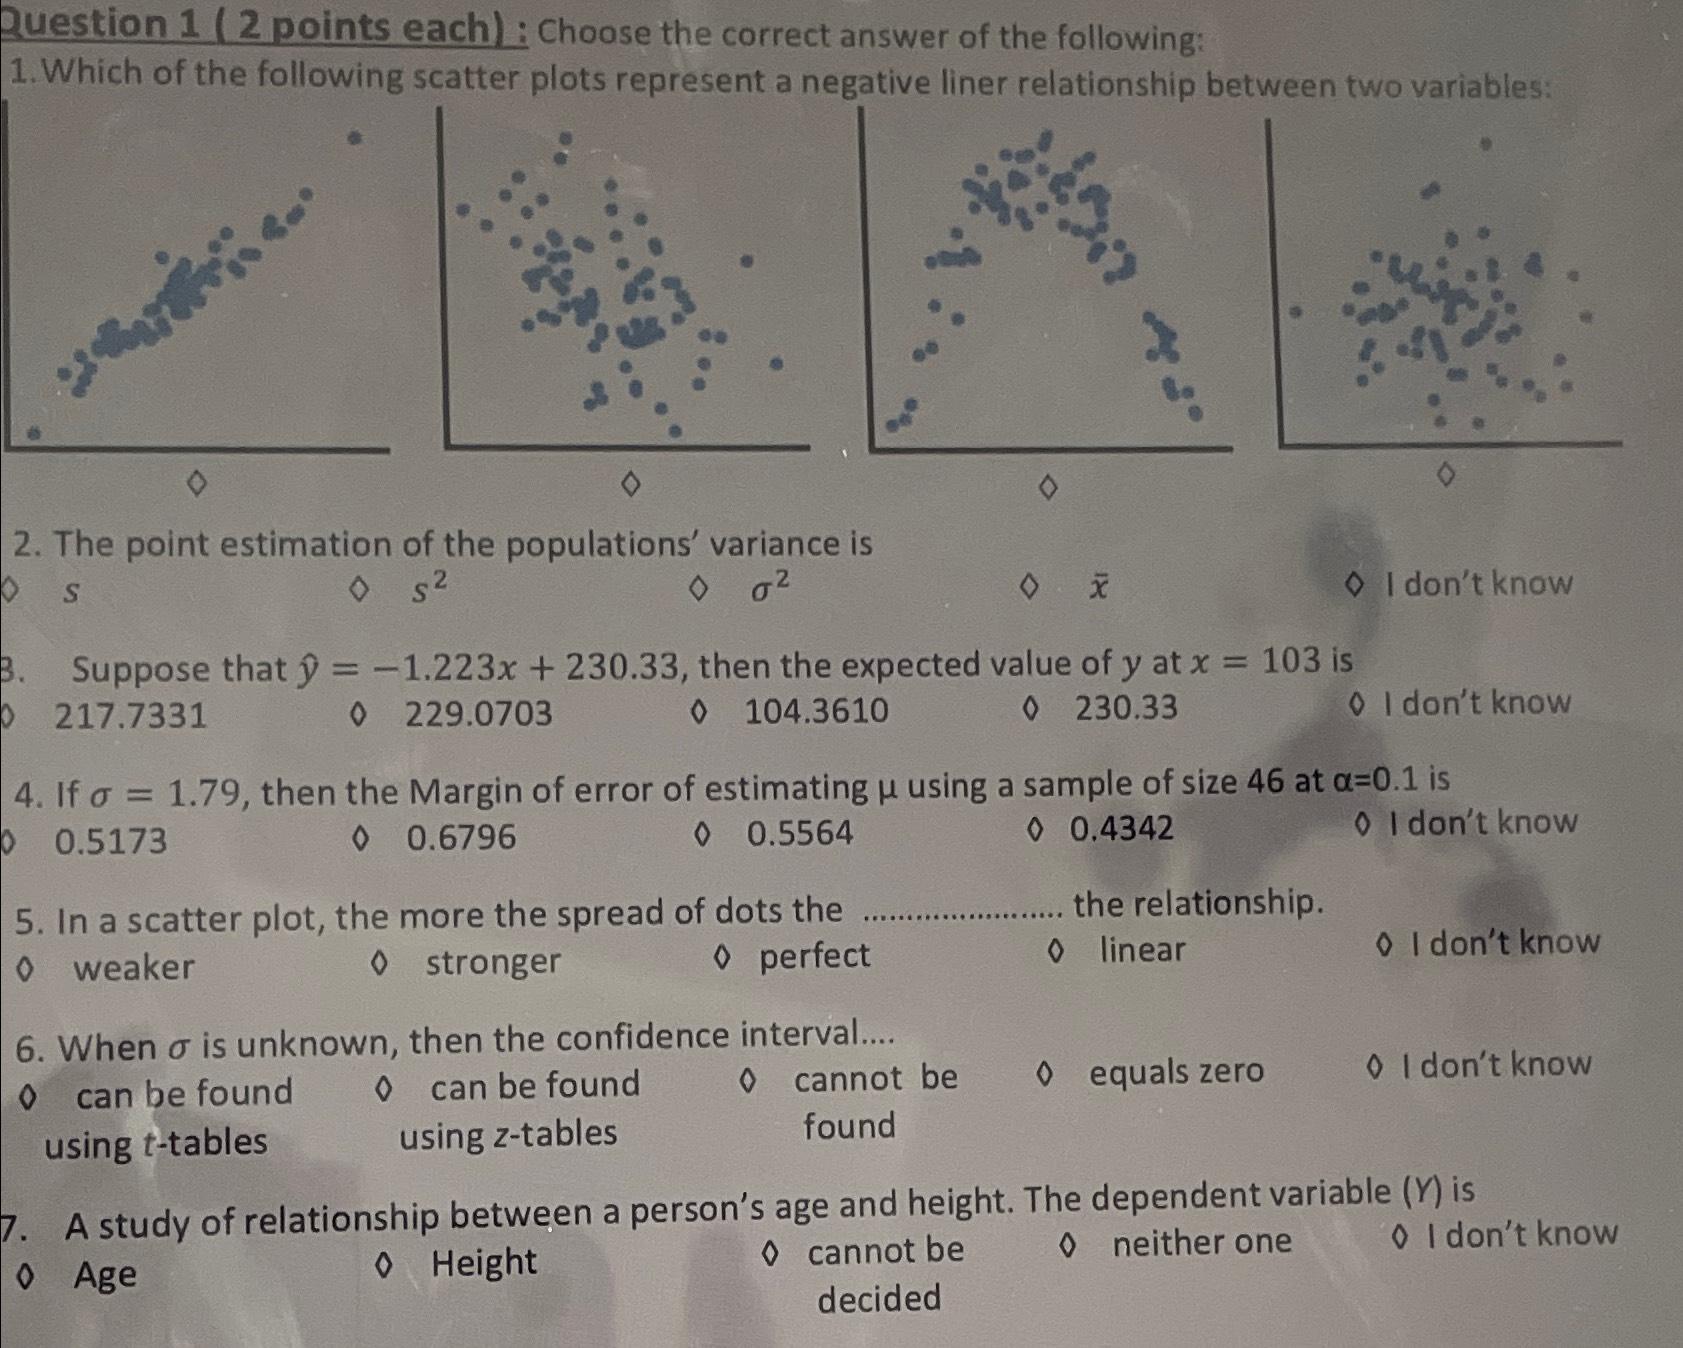
Which of the following scatter plots represent a negative liner relationship between two variables:
The point estimation of the populations' variance is
diamond
diamond
I don't know
Suppose that hat then the expected value of at is
o
o I don't know
If then the Margin of error of estimating using a sample of size at is
O I don't know
In a scatter plot, the more the spread of dots the the relationship.
weaker
stronger
perfect
linear
I don't know
When is unknown, then the confidence interval....
can be found
can be found
cannot be
equals zero
I don't know using tables using tables found
A study of relationship between a person's age and height. The dependent variable is
Age
Height
cannot be
neither one
I don't know decided
Step by Step Solution
There are 3 Steps involved in it
1 Expert Approved Answer
Step: 1 Unlock

Question Has Been Solved by an Expert!
Get step-by-step solutions from verified subject matter experts
Step: 2 Unlock
Step: 3 Unlock