

Question: Question 1 (2 points) Saved After performing the experiment, the student generated the graph below. Concentration (mol/L) 0.070 0.065 0.060 0.055 0.050 0.045 0.040 0.035
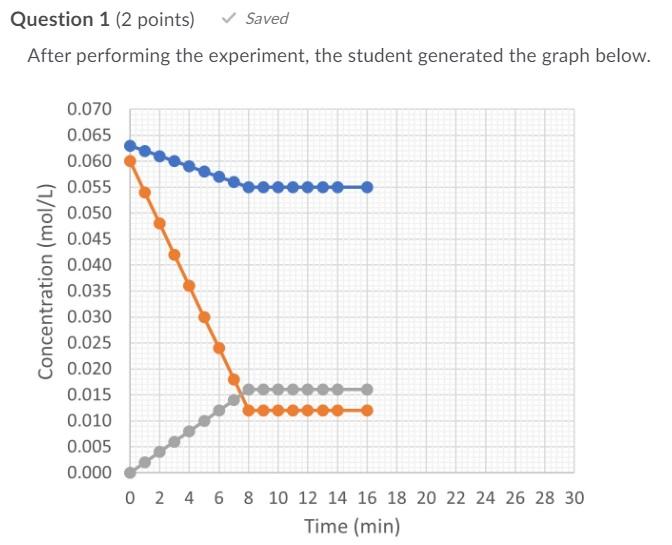
Question 1 (2 points) Saved After performing the experiment, the student generated the graph below. Concentration (mol/L) 0.070 0.065 0.060 0.055 0.050 0.045 0.040 0.035 0.030 0.025 0.020 0.015 0.010 0.005 0.000 0 2 4 6 8 10 12 14 16 18 20 22 24 26 28 30 Time (min) Analyze the graph to determine if it is complete and ready to be submitted for evaluation. Are all the key elements included? Match the following criteria with the options on the right. Hint: In addition to the Tutorial 1 activity where you constructed similar graphs in Excel, you can also review all the key features required for a complete and clear graph in your Lab Manual, Appendix B ([Lab Manual] Appendices), where visual communication using graphs is outlined. 1 Vertical axis label > N Line or Curve labels 1. present and correct 1 1 > Scaling of the graph (i.e. portion of the graph area occupied by the curves). 2. partly missing or partly incorrect 3. missing or completely incorrect 3 Graph title 1 1 Horizontal axis label
Step by Step Solution
There are 3 Steps involved in it

Get step-by-step solutions from verified subject matter experts