

Question: Question 1 2 pts Which can be classified under descriptive statistics? O The OCTA group forecasts that the total number of COVID19 cases in the


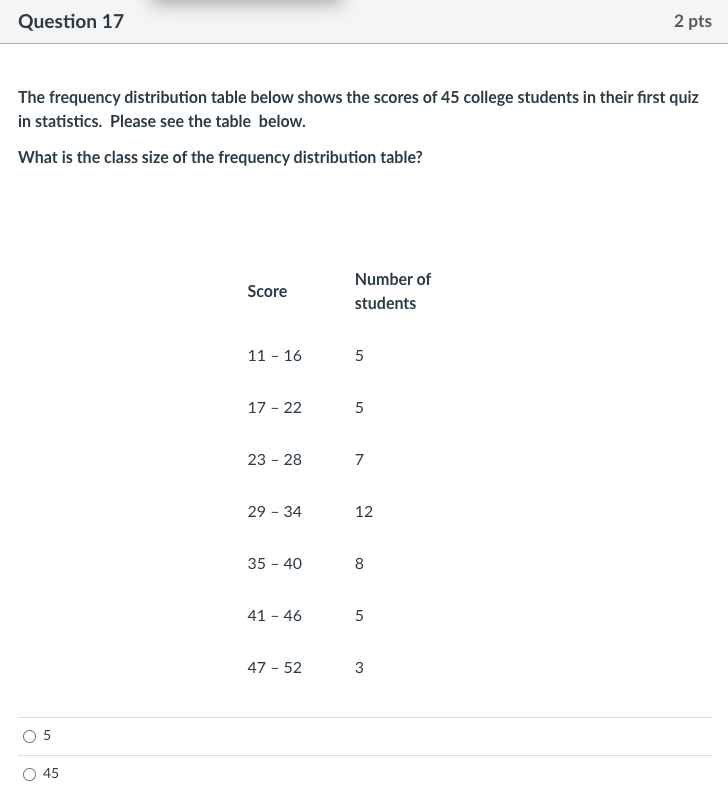


Question 1 2 pts Which can be classified under descriptive statistics? O The OCTA group forecasts that the total number of COVID19 cases in the Philippines will reach 1 million. O Some studies show that there is no sufficient evidence that ivermectin is a prophylaxis medicine for COVID19. O Studies concluded that COVID 19 vaccine has 100% efficacy rate for COVID 19 severe case. O The total number of new COVID19 cases in the Philippines last April 10, 2021 is 12,655.Question 2 2 pts Which can be classified under inferential statistics? O The line graph of COVID19 new cases on March 2021 is increasing. O An economist forecasts that the Philippine grosss national product will still be negative next quarter. O The total number of COVID19 cases is the Philippines is now more than 800,000. O The trend of the Philippine gross domestic product is going down due to the pandemic.Question 3 2 pts On what scale of measurement can you classify the variable "number of COVID19 cases"? O nominal O interval O ordinal O ratioQuestion 4 2 pts COVID19 severity cases have the following levels: asymptomatic, mild, moderate, critical/severe. On what level of measurement can this be classified? O interval O ordinal O nominal O ratioQuestion 5 Which variable belongs to the interval level? O IQ score O Likert scale O temperature in Kelvin O socioeconomic statusQuestion 6 Which variable belongs to the ordinal level? O Project evaluation using Likert scale O Temperature in Celsius O COVID19 case information on death or recovery O Participation in vaccination programQuestion 7 Which variable belongs to the nominal level? O government positions O COVID19 case information whether died or recovered O age groups O school grade levelQuestion 8 2 pts Assume that there are 3 million college students in the Philippines today. Suppose that you want to determine the mean GPA (grade point average) of all of these college students while on online/distance learning classes. To save time and money, you randomly selected 1,000 college students and computed their average GPA. What is the population of the study? O The 1,000 college students in the Philippines O The mean GPA of 1,000 college students O The average GPA of 3 million college students O The 3 million college students in the PhilippinesQuestion 9 2 pts Assume that there are 3 million college students in the Philippines today. Suppose that you want to determine the mean GPA (grade point average) of all of these college students while on online/distance learning classes. To save time and money, you randomly selected 1,000 college students and computed their average GPA. What is the variable of interest of this study? O gender of college students in the Philippines O scholarships of college students in the Philippines O GPA of the college students in the Philippines O number of college students in the PhilippinesQuestion 11 2 pts Assume that there are 3 million college students in the Philippines today. Suppose that you want to determine the mean GPA (grade point average) of all of these college students while on online/distance learning classes. To save time and money, you randomly selected 1,000 college students and computed their average GPA. Which of the following is true about the variable of interest? O It is quantitative and discrete. O It is qualitative and nominal. O It is quantitative and continuous. O It is qualitative and ordinal.Question 17 2 pts The frequency distribution table below shows the scores of 45 college students in their first quiz in statistics. Please see the table below. What is the class size of the frequency distribution table? Number of Score students 11 - 16 5 17 - 22 5 23 - 28 7 29 - 34 12 35 - 40 8 41 - 46 5 47 - 52 3 0 5 O 45 An economist collected data on the Gross Domestic Product {GDP} of his country per quarter. He wants to plot his data on the graph and to show the change in GDP for eirerapr quarter and take note of the trends. Which graph would be the most appropriate? 0 pie graph C} stemplot C} line graph {3 histogram Question 19 2 pts Which cannot improve a pie graph? O Use different colors to distinguish sections of the pie and indicate the category with percentage. O Arrange components of the pie chart according to magnitude O If there is an "Others" category, put it in the first section O Plot the biggest slice at 12 o clockQuestion 20 A stem and leaf display has a leaf unit of 10. What is the actual value of 816? O 860 8600 O 86 O 8.6Question 21 2 pts Which graph is appropriate if you want to compare frequencies of categories of a qualitative variable? O stem plot O line graph O bar graph O pie graph
Step by Step Solution
There are 3 Steps involved in it

Get step-by-step solutions from verified subject matter experts