

Question: Question 1 20 pts Please show all the work, draw sketches, and shade the appropriate regions wherever required. You can use calculator and formula card.
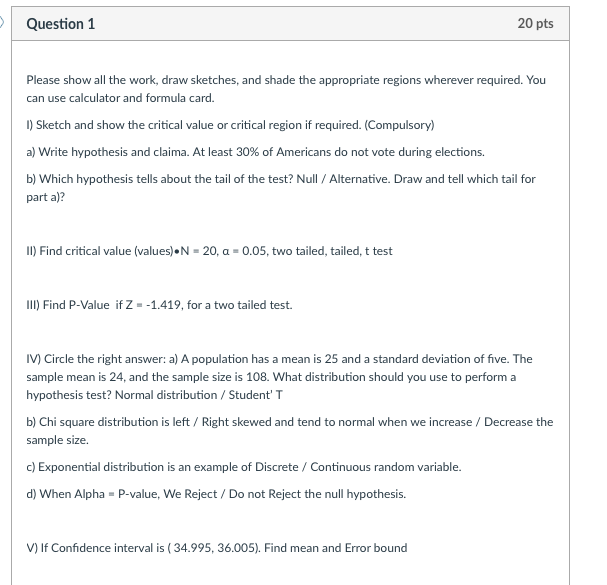
Question 1 20 pts Please show all the work, draw sketches, and shade the appropriate regions wherever required. You can use calculator and formula card. I) Sketch and show the critical value or critical region if required. (Compulsory) a) Write hypothesis and claima. At least 30% of Americans do not vote during elections. b) Which hypothesis tells about the tail of the test? Null / Alternative. Draw and tell which tail for part a)? 1) Find critical value (values) . N = 20, a = 0.05, two tailed, tailed, t test Ill) Find P-Value if Z = -1.419, for a two tailed test. IV) Circle the right answer: a) A population has a mean is 25 and a standard deviation of five. The sample mean is 24, and the sample size is 108. What distribution should you use to perform a hypothesis test? Normal distribution / Student' T b) Chi square distribution is left / Right skewed and tend to normal when we increase / Decrease the sample size. c) Exponential distribution is an example of Discrete / Continuous random variable. d) When Alpha = P-value, We Reject / Do not Reject the null hypothesis. V) If Confidence interval is ( 34.995, 36.005). Find mean and Error bound
Step by Step Solution
There are 3 Steps involved in it

Get step-by-step solutions from verified subject matter experts