

Question: QUESTION 1 (25 marks) Read the following scenario and answer the questions that follow: Referring to the US market, the following table shows the returns
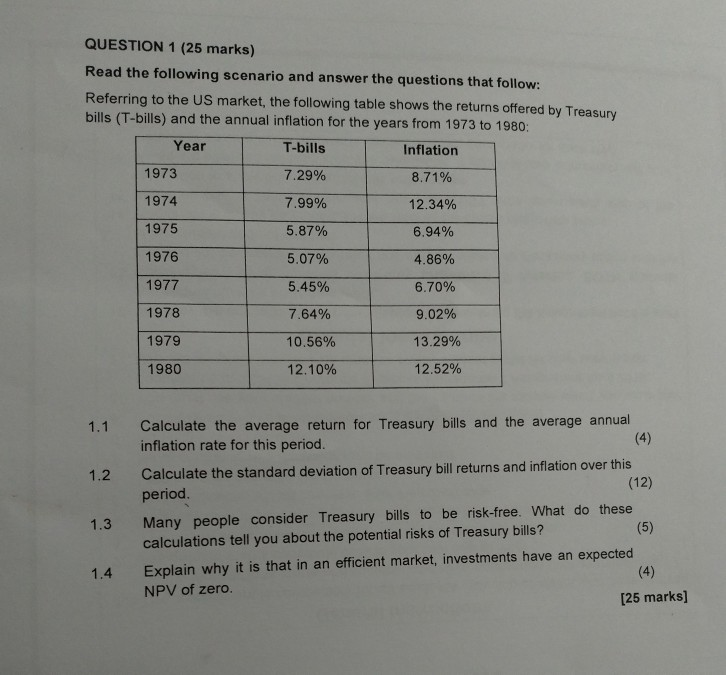
QUESTION 1 (25 marks) Read the following scenario and answer the questions that follow: Referring to the US market, the following table shows the returns offered by Treasury bills (T-bills) and the annual inflation for the years from 1973 to 1980: T-bills 7.29% 7.99% 5.87% 507% 5.45% 7.64% 10.56% 12.10% Year 1973 1974 1975 1976 1977 1978 1979 1980 Inflation 8.71% 12.34% 6.94% 4.86% 670% 9.02% 13.29% 12.52% Calculate the average return for Treasury bills and the average annual inflation rate for this period. 1.1 Calculate the standard deviation of Treasury bill returns and inflation over this period 1.2 (12) Many people consider Treasury bills to be risk-free. What do these calculations tell you about the potential risks of Treasury bills? 1.3 Explain why it is that in an efficient market, investments have an expected NPV of zero. 1.4 [25 marks]
Step by Step Solution
There are 3 Steps involved in it

Get step-by-step solutions from verified subject matter experts