

Question: Question 1 (25 Marks): Select a variable and collect at least 30 values. For example, you may ask the students in your class how many
Question 1 (25 Marks): Select a variable and collect at least 30 values. For example, you may ask the students in your class how many hours they study per week or how old they are, etc..
a. State the purpose of the project.(1 marks)
b. Define the population.(1 marks) c. State how the sample was selected.(3 marks) d. Show the raw data.(1 marks) e. Construct a frequency distribution for the data.(3 marks) f. Draw a histogram, frequency polygon, and ogive for the data.(3 marks for each, total 9 marks) g. Analyze the results.(7 marks)
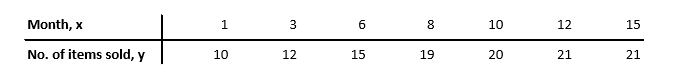
Question 2 (25 Marks): When the points in a scatter plot show a curvilinear trend rather than a linear trend, statisticians have methods of fitting curves rather than straight lines to the data, thus obtaining a better fit and a better prediction model. One type of curve that can be used is the logarithmic regression curve. The data shown are the number of items of a new product sold over a period of 15 months at a certain store. Notice that sales rise during the beginning months and then level off later on.
\f
Step by Step Solution
There are 3 Steps involved in it

Get step-by-step solutions from verified subject matter experts