

Question: Question 1 (25 Points) - Write a matlab program that draws the graphics given below on two different windows. First graph is x versus F(x).
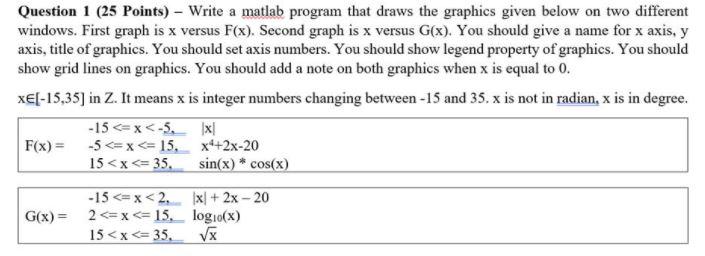
Question 1 (25 Points) - Write a matlab program that draws the graphics given below on two different windows. First graph is x versus F(x). Second graph is x versus G(x). You should give a name for x axis, y axis, title of graphics. You should set axis numbers. You should show legend property of graphics. You should show grid lines on graphics. You should add a note on both graphics when x is equal to 0. XE[-15,35) in Z. It means x is integer numbers changing between-15 and 35. x is not in radian, x is in degree. -15
Step by Step Solution
There are 3 Steps involved in it
1 Expert Approved Answer
Step: 1 Unlock

Question Has Been Solved by an Expert!
Get step-by-step solutions from verified subject matter experts
Step: 2 Unlock
Step: 3 Unlock