

Question: Question 1 - 2-asset portfolio (please include your Excel spreadsheet file) Please refer to your textbook, page 210, Problem PS-12. (NOTE: if you are using
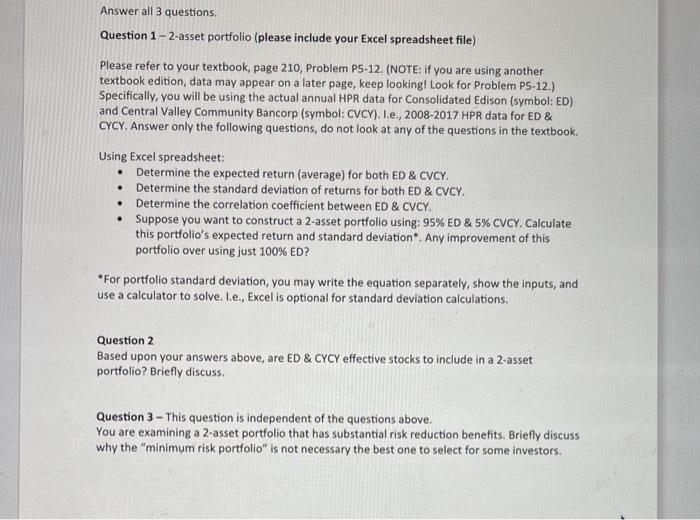
Question 1 - 2-asset portfolio (please include your Excel spreadsheet file) Please refer to your textbook, page 210, Problem PS-12. (NOTE: if you are using another textbook edition, data may appear on a later page, keep looking! Look for Problem PS-12.) Specifically, you will be using the actual annual HPR data for Consolidated Edison (symbol: ED) and Central Valley Community Bancorp (symbol: CVCY). L.e., 2008-2017 HPR data for ED \& CYCY. Answer only the following questions, do not look at any of the questions in the textbook. Using Excel spreadsheet: - Determine the expected return (average) for both ED \& CVCY. - Determine the standard deviation of returns for both ED \& CVCY. - Determine the correlation coefficient between ED \& CVCY. - Suppose you want to construct a 2-asset portfolio using: 95\% ED \& 5\% CVCY. Calculate this portfolio's expected return and standard deviation*. Any improvement of this portfolio over using just 100% ED? "For portfolio standard deviation, you may write the equation separately, show the inputs, and use a calculator to solve. L.e., Excel is optional for standard deviation calculations. Question 2 Based upon your answers above, are ED \& CYCY effective stocks to include in a 2-asset portfolio? Briefly discuss. Question 3 - This question is independent of the questions above. You are examining a 2 -asset portfolio that has substantial risk reduction benefits. Briefly discuss why the "minimum risk portfolio" is not necessary the best one to select for some investors
Step by Step Solution
There are 3 Steps involved in it

Get step-by-step solutions from verified subject matter experts