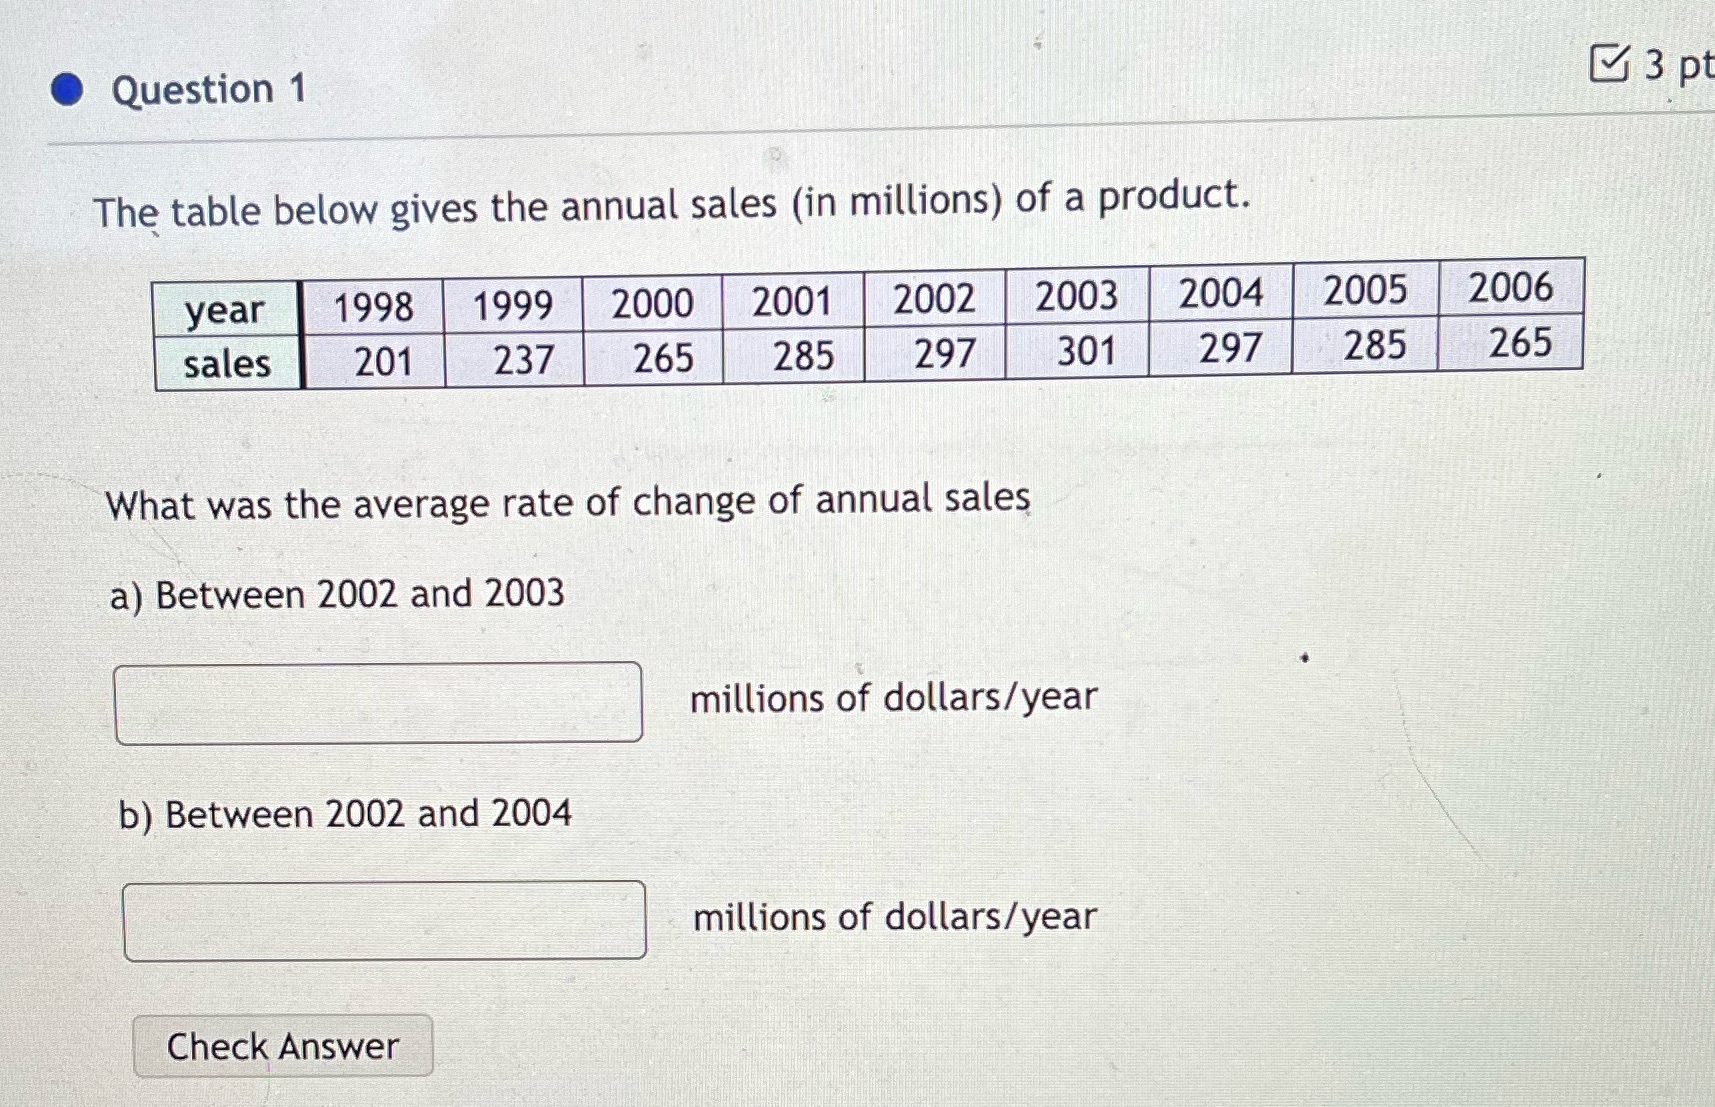
Question: . Question 1 3 p The table below gives the annual sales (in millions) of a product. year 1998 1999 2000 2001 2002 2003 2004

. Question 1 3 p The table below gives the annual
. Question 1 3 p The table below gives the annual sales (in millions) of a product. year 1998 1999 2000 2001 2002 2003 2004 2005 2006 sales 201 237 265 285 297 301 297 285 265 What was the average rate of change of annual sales a) Between 2002 and 2003 millions of dollars/year b) Between 2002 and 2004 millions of dollars/year Check

Step by Step Solution

There are 3 Steps involved in it

1 Expert Approved Answer
Step: 1 Unlock blur-text-image
Question Has Been Solved by an Expert!

Get step-by-step solutions from verified subject matter experts

Step: 2 Unlock
Step: 3 Unlock

Students Have Also Explored These Related Mathematics Questions!