

Question: Question 1 4 ( 1 point ) Here are the two datasets: Notice that the second dataset uses 0 and 1 for ExamScore ( a
Question point
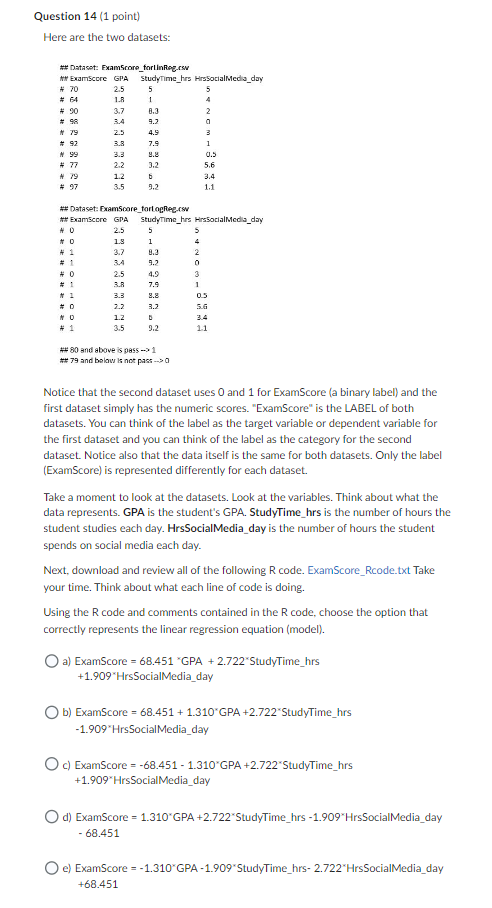
Here are the two datasets:
Notice that the second dataset uses and for ExamScore a binary label and the
first dataset simply has the numeric scores. "ExamScore" is the LABEL of both
datasets. You can think of the label as the target variable or dependent variable for
the first dataset and you can think of the label as the category for the second
dataset. Notice also that the data itself is the same for both datasets. Only the label
ExamScore is represented differently for each dataset.
Take a moment to look at the datasets. Look at the variables. Think about what the
data represents. GPA is the student's GPA. StudyTimehrs is the number of hours the
student studies each day. HrsSocialMediaday is the number of hours the student
spends on social media each day.
Next, download and review all of the following R code. ExamScoreRcode.txt Take
your time. Think about what each line of code is doing.
Using the code and comments contained in the code, choose the option that
correctly represents the linear regression equation model
a ExamScore GPA StudyTimehrs
HrsSocialMediaday
b ExamScore GPA StudyTimehrs
HrsSocialMediaday
c ExamScore GPA StudyTimehrs
HrsSocialMediaday
d ExamScore GPA StudyTimehrs HrsSocialMediaday
e ExamScore GPA StudyTimehrs HrsSocialMediaday
Step by Step Solution
There are 3 Steps involved in it
1 Expert Approved Answer
Step: 1 Unlock

Question Has Been Solved by an Expert!
Get step-by-step solutions from verified subject matter experts
Step: 2 Unlock
Step: 3 Unlock