

Question: Question 1 4 , End - of - Chapter Exercise 1 9 Part 1 of 3 The table to the right shows hypothetical values, in
Question EndofChapter Exercise
Part of
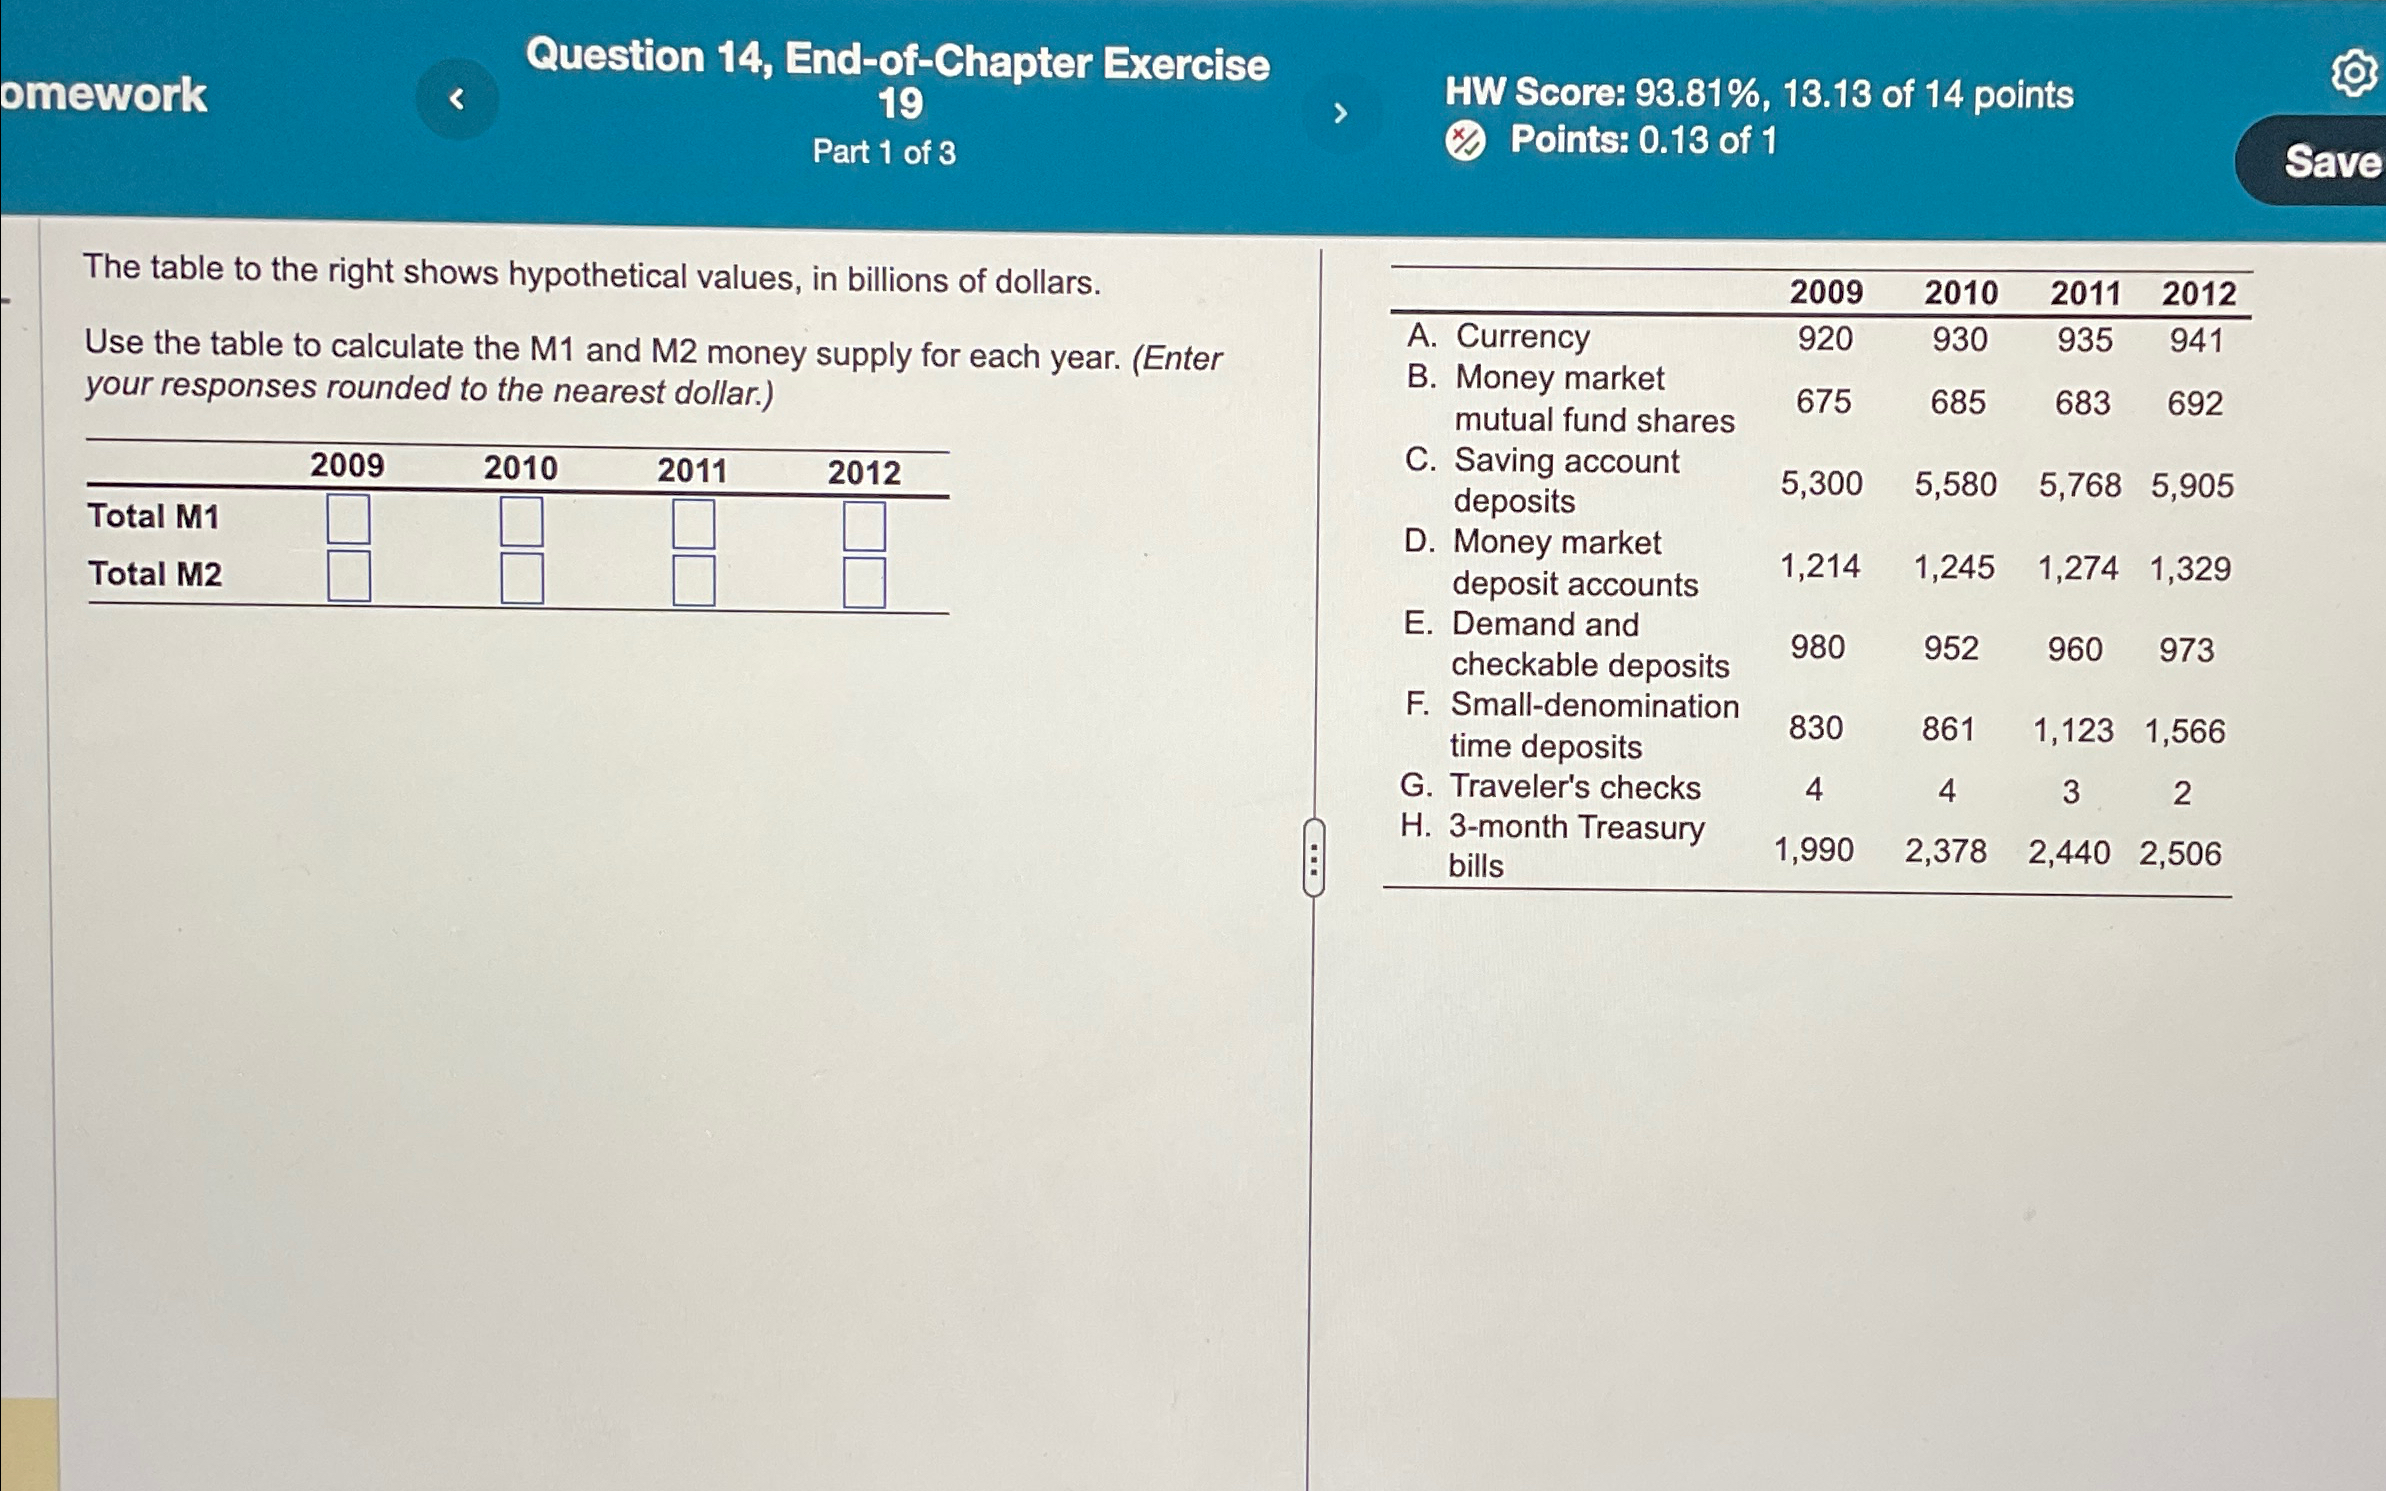
The table to the right shows hypothetical values, in billions of dollars.
Use the table to calculate the M and M money supply for each year. Enter your responses rounded to the nearest dollar.
tableTotal MTotal M
HW Score: of points Points: of
omework
Part of
tableA Currency,tableB Money marketmutual fund sharestableC Saving accountdepositstableD Money marketdeposit accountstableE Demand andcheckable depositstableF Smalldenominationtime depositsG Traveler's checks,tableHmonth Treasurybills
Step by Step Solution
There are 3 Steps involved in it
1 Expert Approved Answer
Step: 1 Unlock

Question Has Been Solved by an Expert!
Get step-by-step solutions from verified subject matter experts
Step: 2 Unlock
Step: 3 Unlock