

Question: Question 1: (4 points) Estimate the functional values and the limits from the graph of the function f provided in Figure 14. Figure 14 If
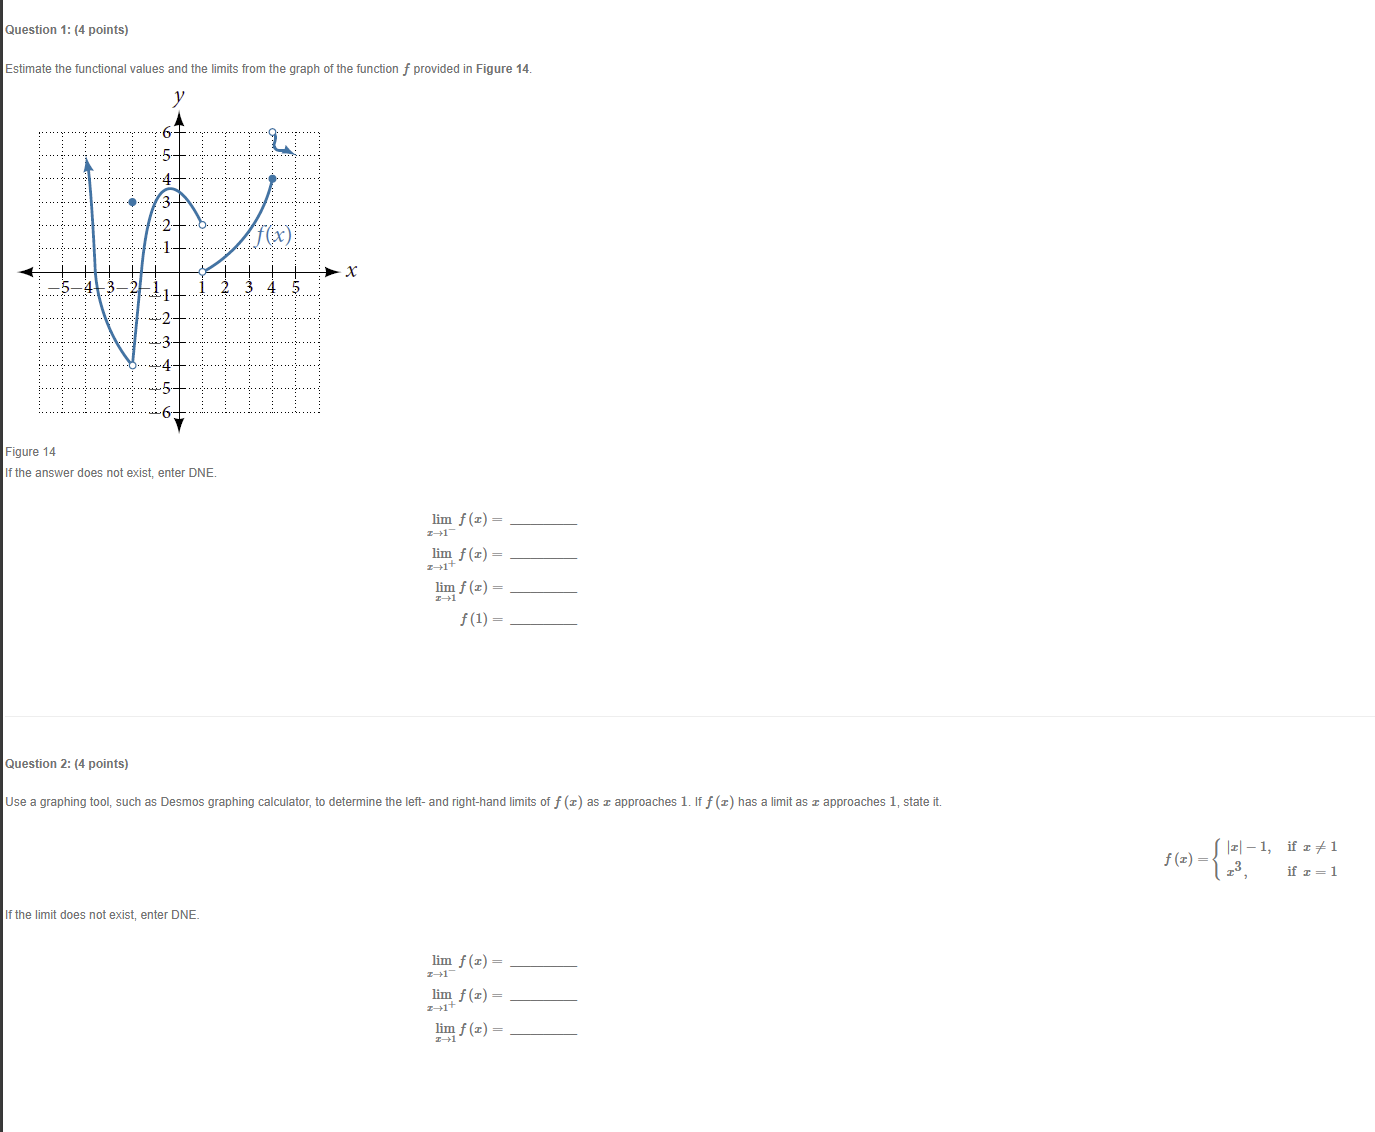
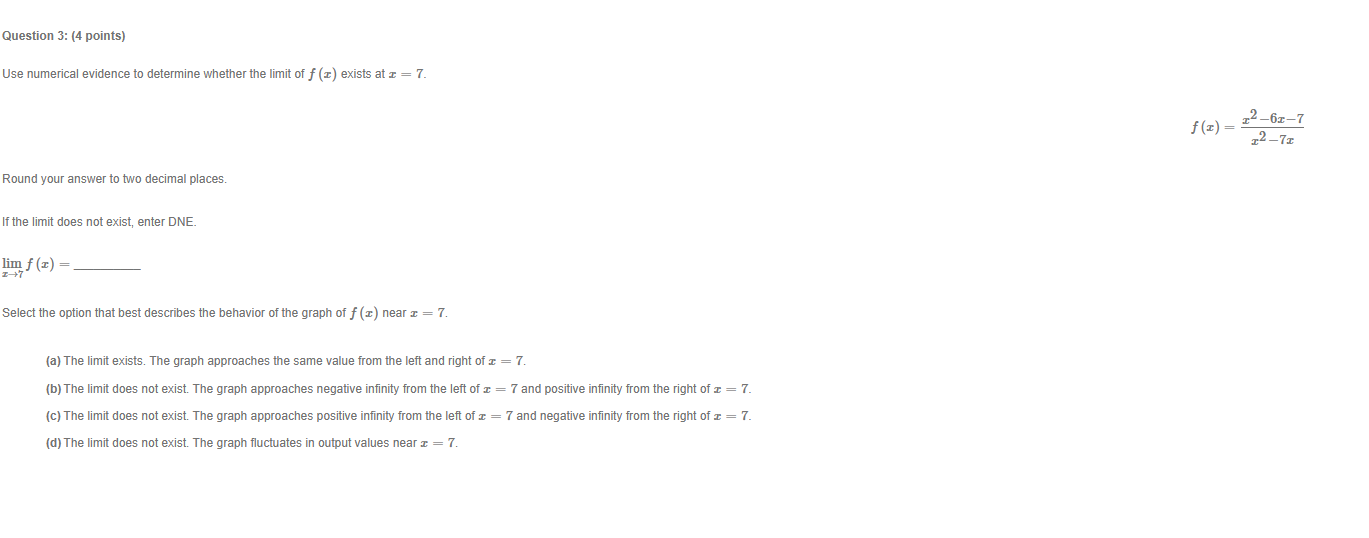
Question 1: (4 points) Estimate the functional values and the limits from the graph of the function f provided in Figure 14. Figure 14 If the answer does not exist, enter DNE. lim f (I) = lim f (x) = lim f (z) = f (1) = Question 2: (4 points) Use a graphing tool, such as Desmos graphing calculator, to determine the left- and right-hand limits of f (x) as a approaches 1. If f (x ) has a limit as a approaches 1, state it. f(z) = 12 -1, if z #1 if I = 1 If the limit does not exist, enter DNE. lim f (z) = 1 +1- lim f (x) = z +1 lim f (I) =Question 3: (4 points) Use numerical evidence to determine whether the limit of f (x ) exists at z = 7. f(z) - 14-61-7 12-71 Round your answer to two decimal places. If the limit does not exist, enter DNE. lim f (x) = I +7' Select the option that best describes the behavior of the graph of f (z) near z = 7. (a) The limit exists. The graph approaches the same value from the left and right of z = 7. (b) The limit does not exist. The graph approaches negative infinity from the left of c = 7 and positive infinity from the right of z = 7. (c) The limit does not exist. The graph approaches positive infinity from the left of I = 7 and negative infinity from the right of z = 7. (d) The limit does not exist. The graph fluctuates in output values near c = 7
Step by Step Solution
There are 3 Steps involved in it

Get step-by-step solutions from verified subject matter experts