

Question: Question 1 [45 marks] Based on the data collected by the management: Provide histograms for the service times for customers in department 1 and department
![Question 1 [45 marks] Based on the data collected by the](https://s3.amazonaws.com/si.experts.images/answers/2024/06/667e414a58b27_282667e414a2d7d9.jpg)
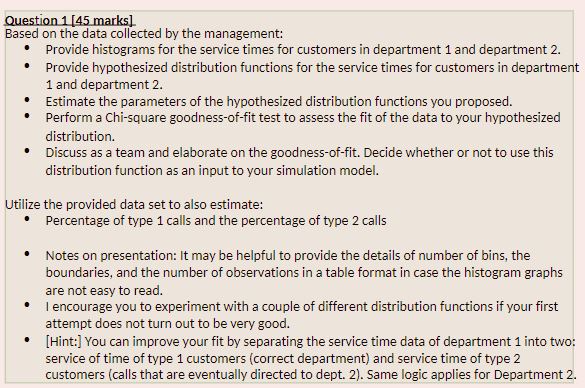
Question 1 [45 marks] Based on the data collected by the management: Provide histograms for the service times for customers in department 1 and department 2. Provide hypothesized distribution functions for the service times for customers in department 1 and department 2. Estimate the parameters of the hypothesized distribution functions you proposed. Perform a Chi-square goodness-of-fit test to assess the fit of the data to your hypothesized distribution. Discuss as a team and elaborate on the goodness-of-fit. Decide whether or not to use this distribution function as an input to your simulation model. Utilize the provided data set to also estimate: Percentage of type 1 calls and the percentage of type 2 calls Notes on presentation: It may be helpful to provide the details of number of bins, the boundaries, and the number of observations in a table format in case the histogram graphs are not easy to read. I encourage you to experiment with a couple of different distribution functions if your first attempt does not turn out to be very good. [Hint:] You can improve your fit by separating the service time data of department 1 into two: service of time of type 1 customers (correct department) and service time of type 2 customers (calls that are eventually directed to dept. 2). Same logic applies for Department 2
Step by Step Solution
There are 3 Steps involved in it

Get step-by-step solutions from verified subject matter experts