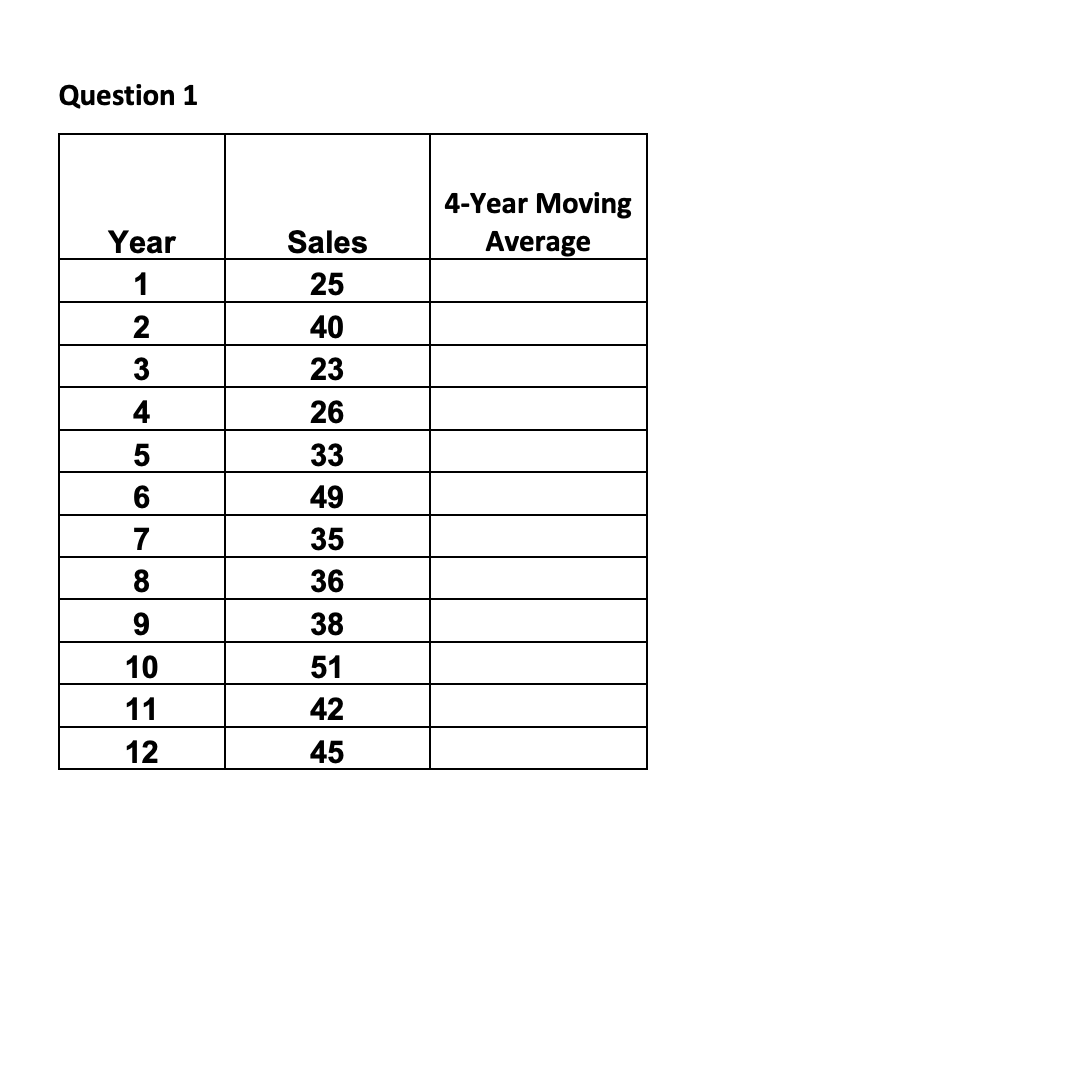
Question: Question 1 4-Year Moving Year Sales Average 25 40 W N 23 26 33 49 NO 35 36 9 38 10 51 11 42 12

Question 1 4-Year Moving Year Sales Average 25 40Question 1 4-Year Moving Year Sales Average 25 40Question 1 4-Year Moving Year Sales Average 25 40Question 1 4-Year Moving Year Sales Average 25 40Question 1 4-Year Moving Year Sales Average 25 40Question 1 4-Year Moving Year Sales Average 25 40Question 1 4-Year Moving Year Sales Average 25 40
Question 1 4-Year Moving Year Sales Average 25 40 W N 23 26 33 49 NO 35 36 9 38 10 51 11 42 12 4550 50 40 30 SALES 20 L0 0 2 4 6 8 10 12 L4 YEAR a} Based on the above graph, identify the Time-Series Components {Trench seasonal, cyclical and irregular component} presenting in the graph and explain. {8 points] b) Find the missing 4-Year Moving Average from the table [Show the calculation}. [12 points} Question 2 Quarterly Data for Umbrella Sales Year Quarter Sales (1000s) (Y.) MA(4) CMA(4) Deasonalized (Y:/S.) Trend Forecast | Forecast 1 Year 1 1 125.0 1.03 121.59 N 153.0 1.23 124.49 3 3 106.0 0.91 0.98 107.97 88.0 0.75 0.76 115.60 5 Year 2 118.0 0.97 1.03 114.78 6 2 161.0 1.27 1.23 131.00 7 3 133.0 1.02 0.98 135.47 8 102.0 0.78 0.76 133.99 Year 3 1 138.0 1.09 1.03 134.23 10 2 144.0 1.19 1.23 117.17 11 W 113.0 0.98 0.98 115.10 12 A 80.0 0.72 0.76 105.09 13 Year 4 109.0 0.98 1.03 106.03 14 2 137.0 1.18 1.23 111.47 15 W 125.0 0.98 127.33 16 A 109.0 0.76 143.19 17 Year 5 18 2 Forecasts --> 19 3 20 AQuarter Seasonal Index (St) 1 1.03 2 L.23 w 0.98 A 0.76 Coefficients Intercept 120.1432764 Sales (Variable) 0.163435 a) Find the missing MA(4). (Show Calculation: 10 points) b) Find the missing CMA(4). (Show Calculation: 10 points) c) Find the missing umbrella sales using the Trend Forecast. (Show Calculation: 10 points)d) Find the missing Forecast sales. (Show Calculation: 10 points) e) Complete the Forecast for Year 5. (Show Calculation: 10 points) Question 3 Business at Tina's Floral Shop can be viewed as falling into three distinct seasons: (1) Christmas (November and December); (2) Mother's Day (late April to May); and (3) all other times. Time Series Analysis and Forecasting of Average weekly sales ($) during the past four years are shown below: Quarterly Sales Data for Tina's Floral Shop Deasonalized Year Quarter Sales (1000s) (Y+) CMA(3) St* It St (Y+/S+) Trend Forecast Forecast Year 1 1769.0 1498.53 1472.37 1738.12 1925.0 1494.33 1511.91 1517.68 1932.35 3 3 789.0 1534.33 1444.30 1562.98 853.83 Year 2 1 1889.0 1592.00 1600.19 1608.28 1898.56 UT 2 2098.0 1659.00 1647.78 1653.59 2105.39 3 990.0 1742.67 1812.24 1698.89 928.08 7 Year 3 1 2140.0 1808.00 1812.81 1744.20 2059.00 2294.0 1814.33 1801.72 1789.50 2278.44 W N 9 1009.0 1819.67 1847.02 1834.80 1002.33 10 Year 4 1 2156.0 1847.67 1826.37 1880.11 2219.44 11 2 2378.0 1873.33 1867.69 1925.4 2451.49 12 3 1086.0 1987.97 1970.72 1076.57 13 Year 5 1 14 Forecasts --> 15 3 Coefficients Intercept 1427.068724 Sales 45.30389871a) Find the missing St* It. (Show Calculation: 10 points) b) Find the missing St. (Show Calculation: 10 points) c) Complete the Forecast for Year 5. (Show Calculation: 10 points)

Step by Step Solution

There are 3 Steps involved in it

1 Expert Approved Answer
Step: 1 Unlock blur-text-image
Question Has Been Solved by an Expert!

Get step-by-step solutions from verified subject matter experts

Step: 2 Unlock
Step: 3 Unlock

Students Have Also Explored These Related Mathematics Questions!