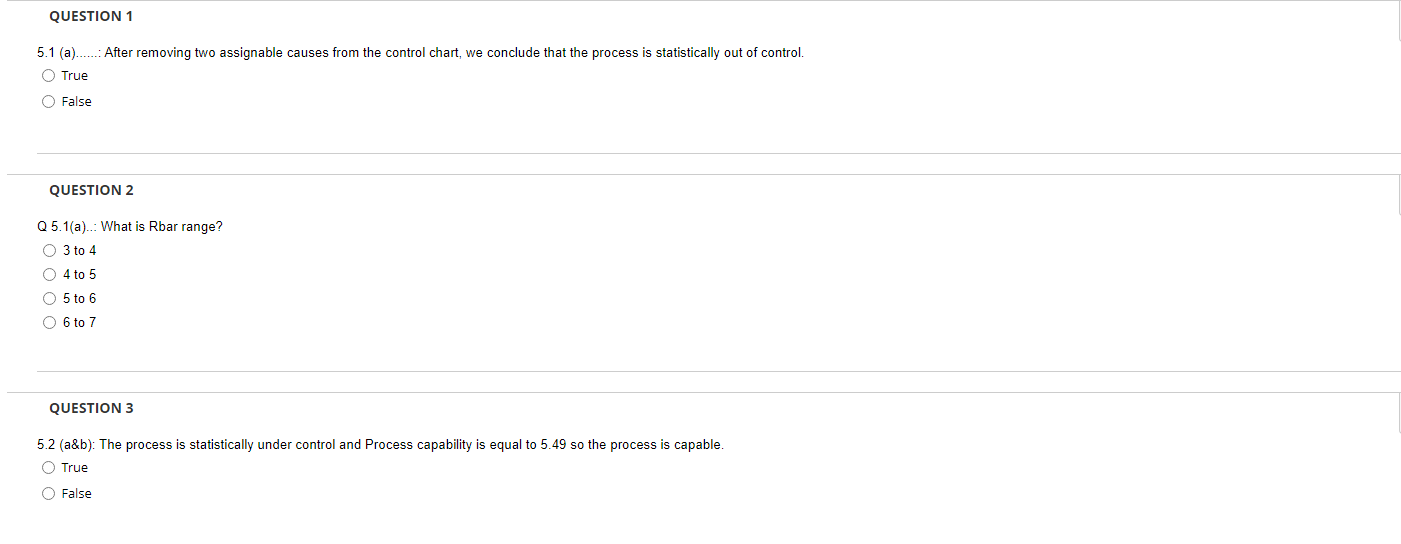
Question: QUESTION 1 5.1 (a).....: After removing two assignable causes from the control chart, we conclude that the process is statistically out of control. O True

QUESTION 1 5.1 (a).....: After removing two

QUESTION 1 5.1 (a).....: After removing two assignable causes from the control chart, we conclude that the process is statistically out of control. O True False QUESTION 2 Q5.1(a).: What is Rbar range? O 3 to 4 0 4 to 5 O 5 to 6 O 6 to 7 QUESTION 3 5.2 (a&b): The process is statistically under control and Process capability is equal to 5.49 so the process is capable. True O False QUESTION 1 5.1 (a).....: After removing two assignable causes from the control chart, we conclude that the process is statistically out of control. O True False QUESTION 2 Q5.1(a).: What is Rbar range? O 3 to 4 0 4 to 5 O 5 to 6 O 6 to 7 QUESTION 3 5.2 (a&b): The process is statistically under control and Process capability is equal to 5.49 so the process is capable. True O False

Step by Step Solution

There are 3 Steps involved in it

1 Expert Approved Answer
Step: 1 Unlock blur-text-image
Question Has Been Solved by an Expert!

Get step-by-step solutions from verified subject matter experts

Step: 2 Unlock
Step: 3 Unlock

Students Have Also Explored These Related General Management Questions!