

Question: Question 1 6 ( 5 pts ) : Instructions: Go to worksheet # 1 6 in the Excel Exam data file. Note the Income Statement
Question pts:
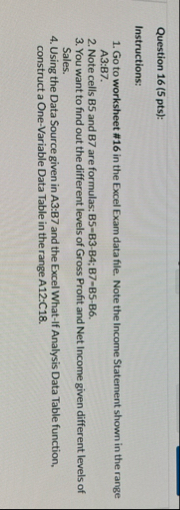
Instructions:
Go to worksheet # in the Excel Exam data file. Note the Income Statement shown in the range A:B
Note cells B and B are formulas: BBB;BBB
You want to find out the different levels of Gross Profit and Net Income given different levels of Sales.
Using the Data Source given in A:B and the Excel WhatIf Analysis Data Table function, construct a OneVariable Data Table in the range A:CtableABWorksheet #Sales,Less Cost of Sales,Gross Profit,Less Operating Expense,Net Income,
Step by Step Solution
There are 3 Steps involved in it
1 Expert Approved Answer
Step: 1 Unlock

Question Has Been Solved by an Expert!
Get step-by-step solutions from verified subject matter experts
Step: 2 Unlock
Step: 3 Unlock