

Question: QUESTION 1 6 CHAPTER 3 produced in the previous month. table [ [ , Sample Sample Sample Sample Sample, ] , [ , 1
QUESTION
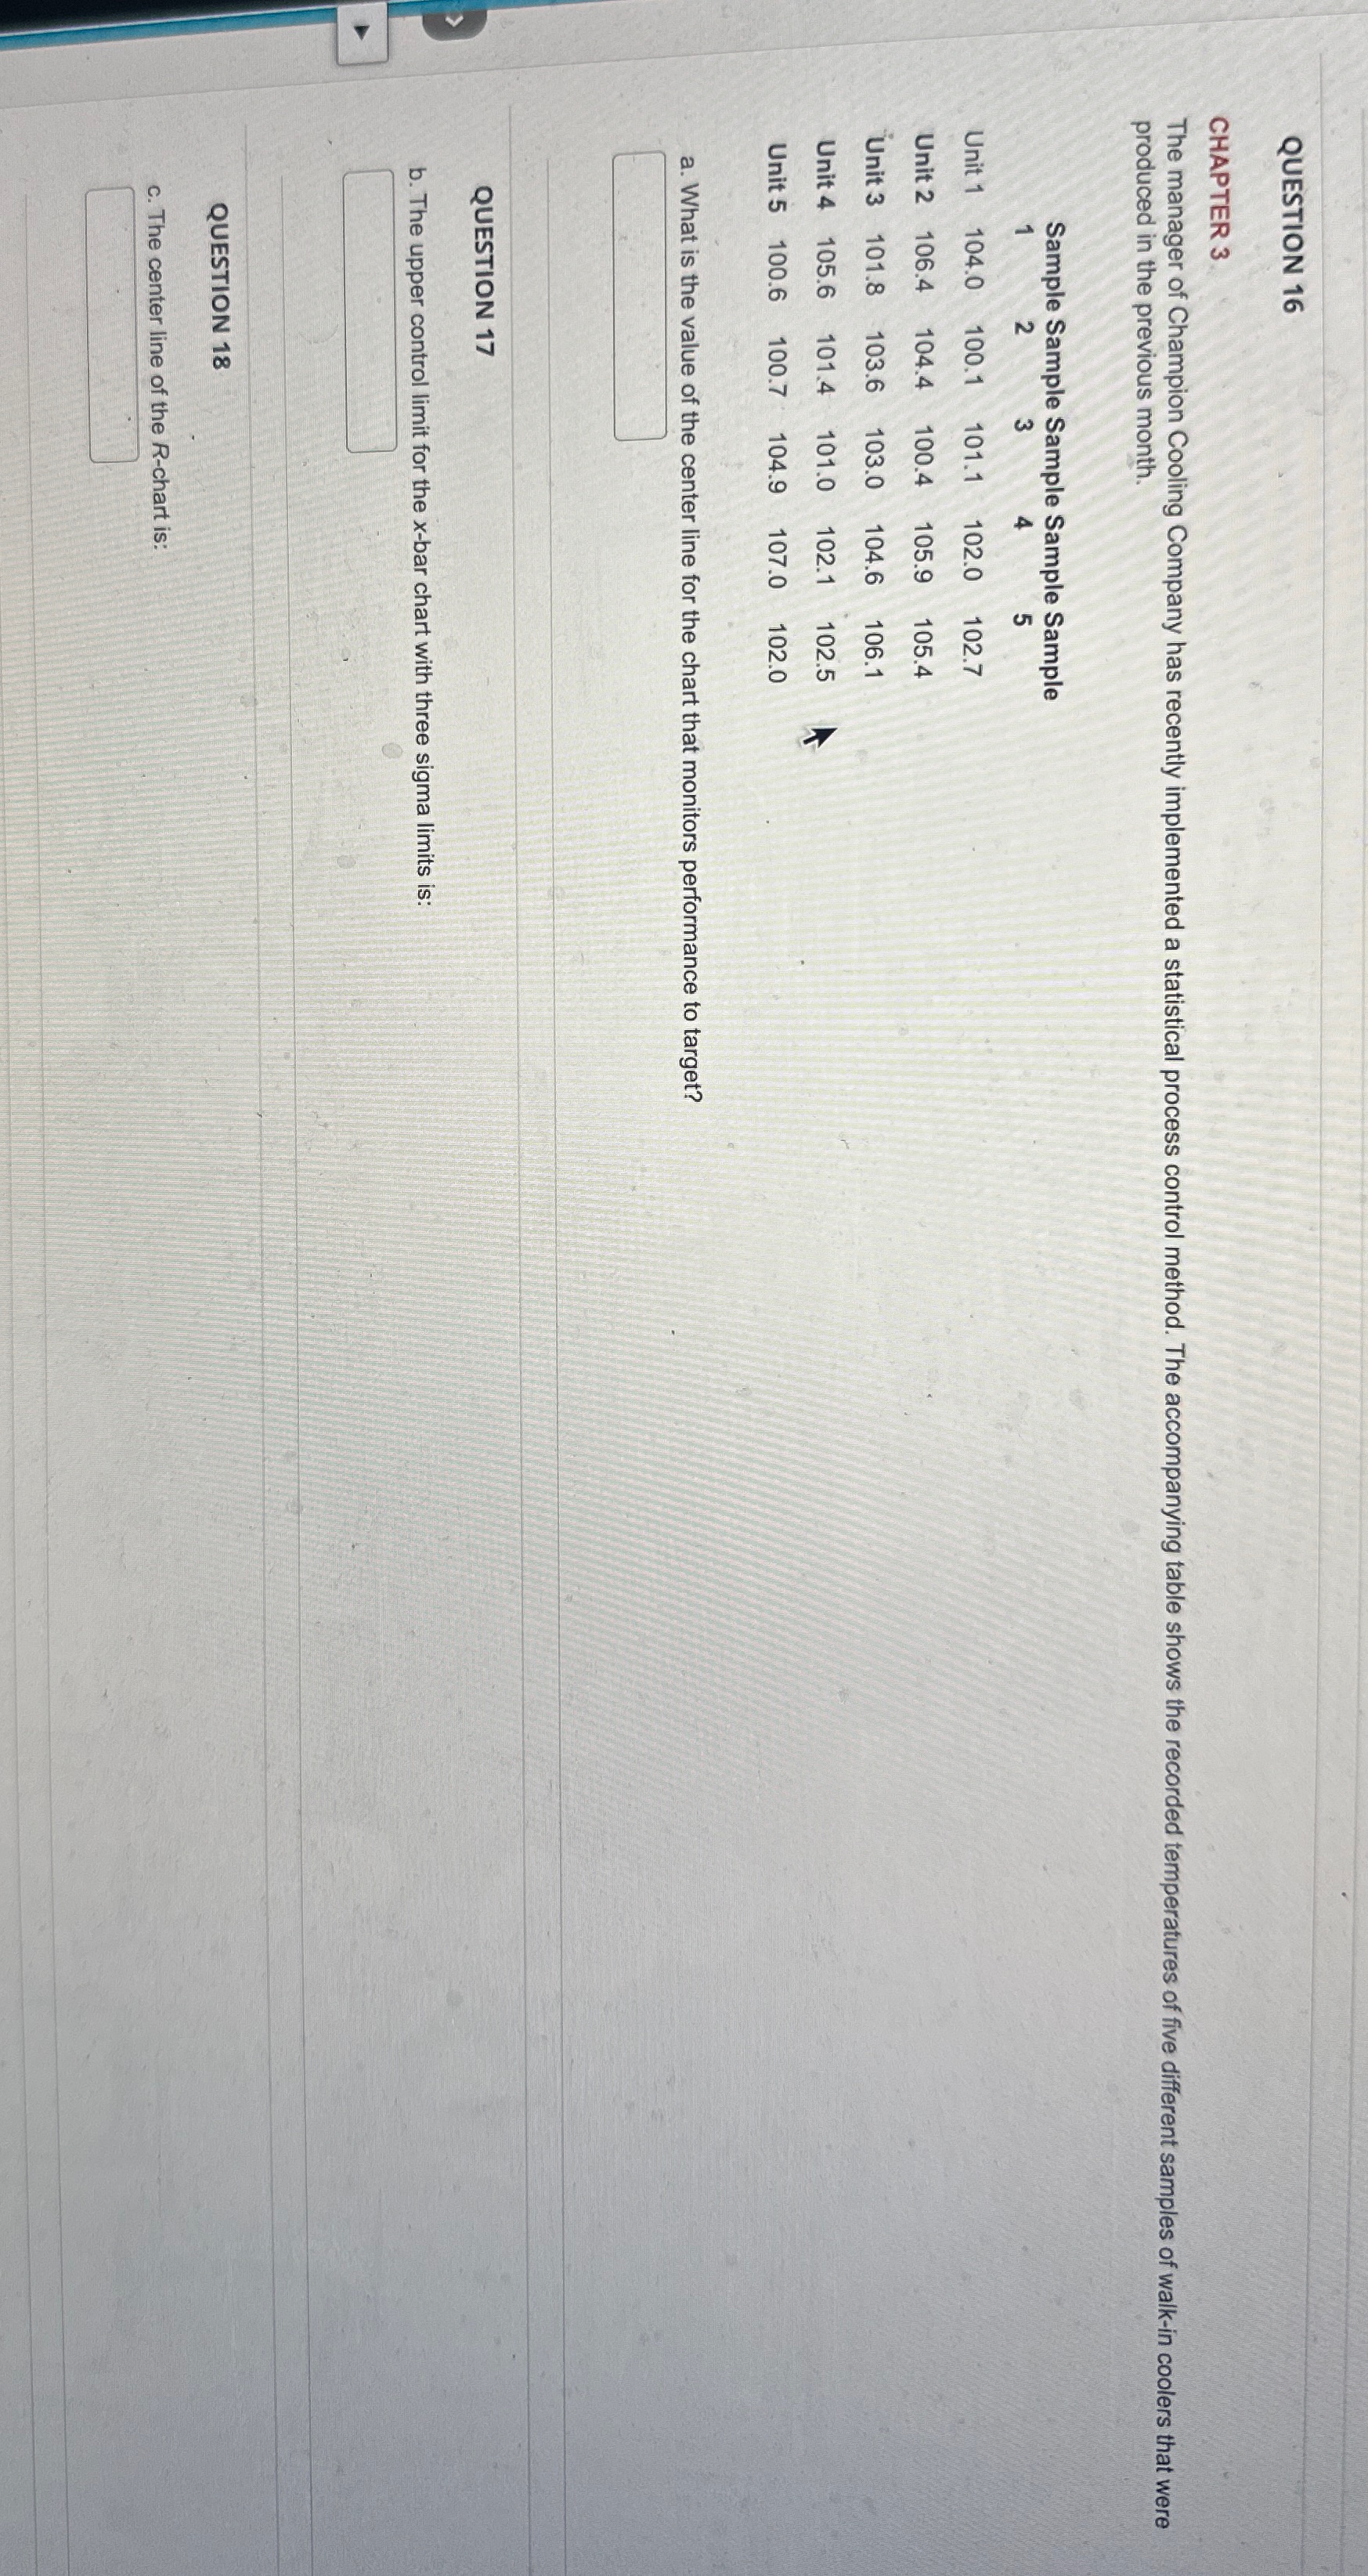
CHAPTER produced in the previous month.
tableSample Sample Sample Sample Sample,Unit Unit Unit Unit Unit
a What is the value of the center line for the chart that monitors performance to target?
QUESTION
b The upper control limit for the bar chart with three sigma limits is:
QUESTION
c The center line of the chart is:
Step by Step Solution
There are 3 Steps involved in it
1 Expert Approved Answer
Step: 1 Unlock

Question Has Been Solved by an Expert!
Get step-by-step solutions from verified subject matter experts
Step: 2 Unlock
Step: 3 Unlock