

Question: Question 1 (7 points) You downloaded the annual returns (over 21 years from 2000 to 2020) on the S&P500, US 10-year Treasury-Bond and US 3-month
Question 1 (7 points)
You downloaded the annual returns (over 21 years from 2000 to 2020) on the S&P500, US 10-year Treasury-Bond and US 3-month Treasury-Bill. Using this historical data as a sample, you want to estimate the following statistics for S&P500 Index. Show the result rounded up to the second digit after the decimal point (e.g. 5.53% for return and 0.35 for correlation and Sharpe ratio).
Sharpe ratio (using 3-month Treasury-Bill return as the risk-free rate)
What was the compound rate of annual return that was actually earned over the last 21 years?
Explain the difference between the standard deviation of the sample and the standard error of the sample mean which as followed.
Data:
| Return | Return | Return | |
| Year | S&P 500 | 10 Year T-Bond | 3-month T-Bill |
| 2000 | -10.14% | 5.11% | 5.73% |
| 2001 | -13.04% | 5.05% | 1.80% |
| 2002 | -23.37% | 3.81% | 1.20% |
| 2003 | 26.38% | 4.25% | 1.00% |
| 2004 | 8.99% | 4.22% | 2.18% |
| 2005 | 3.00% | 4.39% | 4.31% |
| 2006 | 13.62% | 4.70% | 4.88% |
| 2007 | 3.53% | 4.02% | 3.31% |
| 2008 | -38.49% | 2.21% | 1.59% |
| 2009 | 23.45% | 3.84% | 0.14% |
| 2010 | 12.78% | 3.29% | 0.13% |
| 2011 | 0.00% | 1.88% | 0.03% |
| 2012 | 13.41% | 1.76% | 0.05% |
| 2013 | 29.60% | 3.04% | 0.07% |
| 2014 | 11.39% | 2.17% | 0.05% |
| 2015 | -0.73% | 2.27% | 0.21% |
| 2016 | 9.54% | 2.45% | 0.51% |
| 2017 | 19.42% | 2.41% | 1.39% |
| 2018 | -6.24% | 2.68% | 2.37% |
| 2019 | 28.88% | 1.92% | 1.55% |
| 2020 | 16.26% | 0.93% | 0.09% |
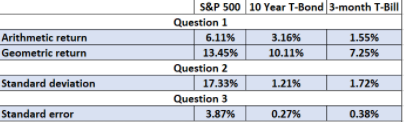
Arithmetic return Geometric return S&P 500 10 Year T-Bond 3-month T-Bill -- Question 1 6.11% 3.16% 1.55% 13.45% 10.11% 7.25% Question 2 17.33% 1.21% 1.72% Question 3 3.87% 0.27% 0.38% Standard deviation Standard error
Step by Step Solution
There are 3 Steps involved in it

Get step-by-step solutions from verified subject matter experts